Learning Concepts in Morphological Databases
Supported by National Science Foundation grant 0641076.
Principal Investigator
Bir Bhanu, Center for Research in Intelligent Systems EBU2
Room 216, University of California at Riverside,
Riverside, CA 92521,
Tel. 951-827-3954, Fax. 951-827-2425
bhanu@cris.ucr.edu
http://www.vislab.ucr.edu/PEOPLE/BIR_BHANU/index.htm
Co-PIs
John Heraty, College of Natural and Agricultural Sciences Entomology, University of California at Riverside, Riverside, CA 92521
john.heraty@ucr.edu
http://www.facultydirectory.ucr.edu/cgi-bin/pub/public_individual.pl?faculty=337
Students
Elizabeth Murray, Yu Sun, Anthony Bianchi, Linan Feng, Krystof Litomisky, Philip Vuong, Cameron Allen
October 2009, From left to right: Linan, Anthony, Dr. Heraty, Dr. Bhanu, Elizabeth, Krystof, and Yu.
Research Findings
The major finding are the following:
(a) Development of a framework and results using a patch-based representation for automated identification of species. Please see the attached
paper (in the Findings File) that has been published in American Entomologist, December 2008.
(b) Development of a symmetry integrated image segmentation technique that is applicable to all living things which have symmetry. This
contributes to the hierarchical representation of data from gloal to local features and parts and their relations. We have applied the basic
technique to a variety of images, including butterflies, wasps, MRI brain images, human faces, vehicles, etc. Two papers describing the
approach and its applications have been accepted in two highly selective conferences: IEEE Computer Society Conference on Computer Vision
and Pattern Recognition, June 2009 and IEEE Computer Society Workshop on Mathematical Methods in Biomedical Image Analysis, June
2009. Both papers are attached in the Findings File.
We plan to demonstrate our approach at the next meeting of Entomological Society of America. We will make the software for symmetry
detection and image segmentation available to the research and application communities soon.
c) Our research involves a phylogenetic revision of a genus of parasitic Hymenoptera. This genus Kapala (Hymenoptera: Eucharitidae) is
composed of 19 species, but that number is expected to increase to 50-70 species under systematic scrutiny.
d) We are comparing several indexing structures (A tree, SR tree, VA file, R* tree and mixture of Gaussians) for efficient images retriveal from
large databases. The recognition algorithms will use the results of indexing for classification and identification.
e) We have developed a prototype system consisting of 80 Million images as an experimental testbed for our research on learning concepts in
morphological databases.
For further details please see the attached Findings file.
Links to Related projects:
Consortium for the Barcode of Life http://www.barcoding.si.edu/
Catalogue of Life http://www.catalogueoflife.org/
Encyclopedia of Life http://www.eol.org/
Morphbank http://www.morphbank.net/
Barcode of Life Data Systems (BOLD) http://www.barcodinglife.org/views/login.php
Current Progress:
Image Segmentation, Performance Optimization
Yu Sun
PhD Candidate
Department of Electrical Engineering
Research Focus:
Image segmentation and symmetry optimization of biological images. We are making use of symmetry property in many natural biology images to improve the segmentation. As the first step in our image database learning system, this approach will increase the performance of pattern classification.
Symmetry-integrated Image Segmentation and its Applications:
This research work integrates symmetry with image segmentation to improve segmentation
performance. The symmetry integration is used to optimize both the segmentation and the
symmetry of regions simultaneously. Interesting points are initially extracted from an image and
they are further refined for detecting symmetry axis. A symmetry affinity matrix is used
explicitly as a constraint in a region growing algorithm in order to refine the symmetry of
segmented regions. The overall system diagram is shown below:
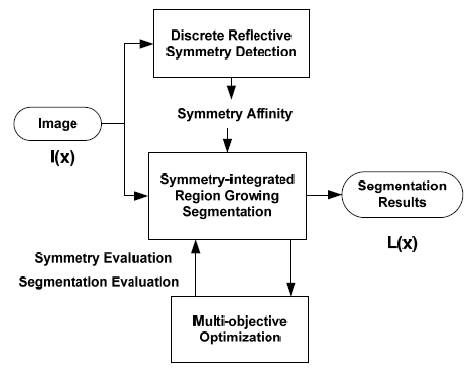
System diagram for symmetry constrained region-integrated image segmentation
The qualitative and quantitative experimental results indicate that, with the symmetry
constraints enforced by symmetry affinity, both the symmetry and segmentation are improved,
with better performances compared to several other region-based segmentation methods.
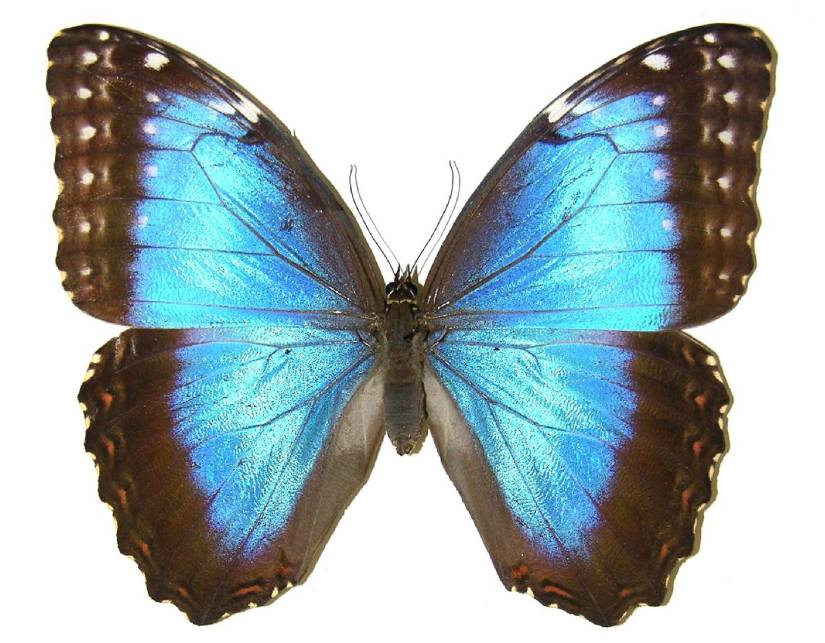
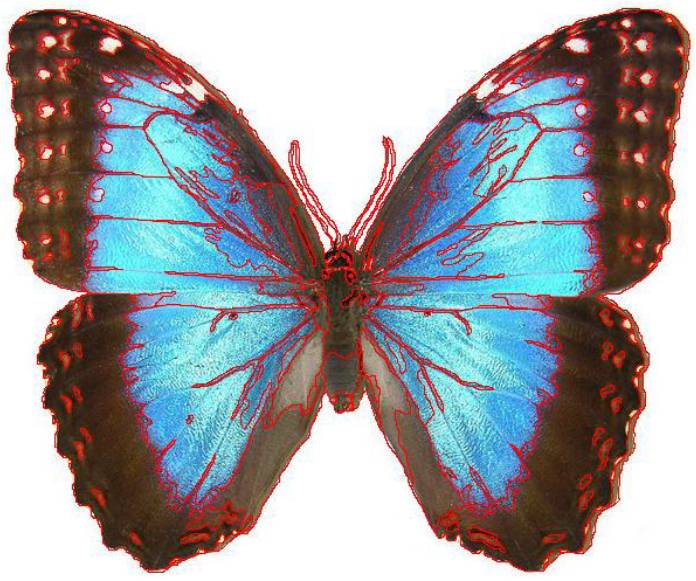
Following is one example of the symmetry-integrated segmentation algorithm:
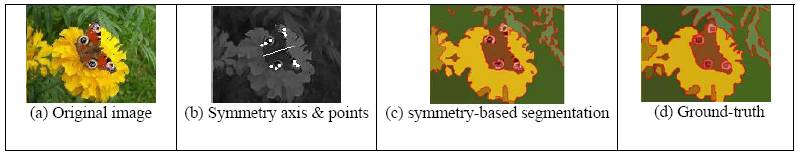
Symmetry-constrained segmentation results and analysis for image butterfly 3
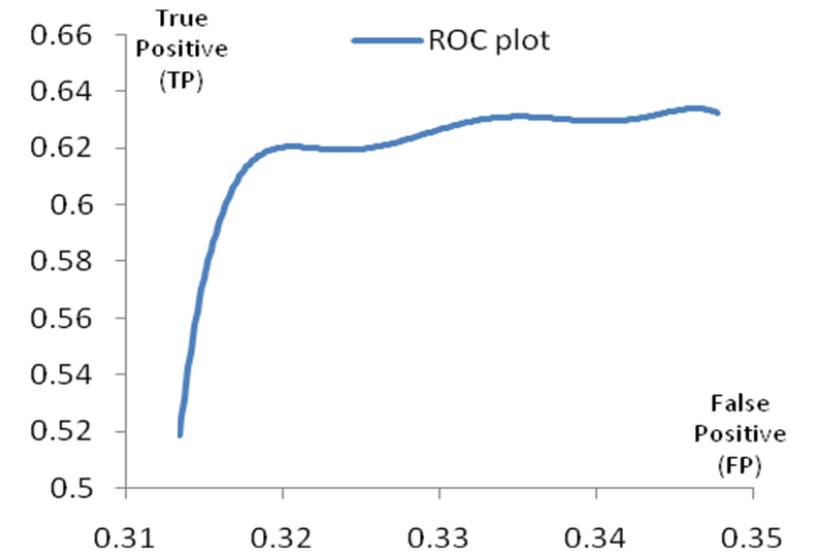
The improvements of symmetry integrated in image segmentation, compared to other
segmentation methods, are indicated in the following quantitative analysis results. We can see
that symmetry-integrated segmentation method gets the highest performance in parameter space,
compared to other segmentation approaches.
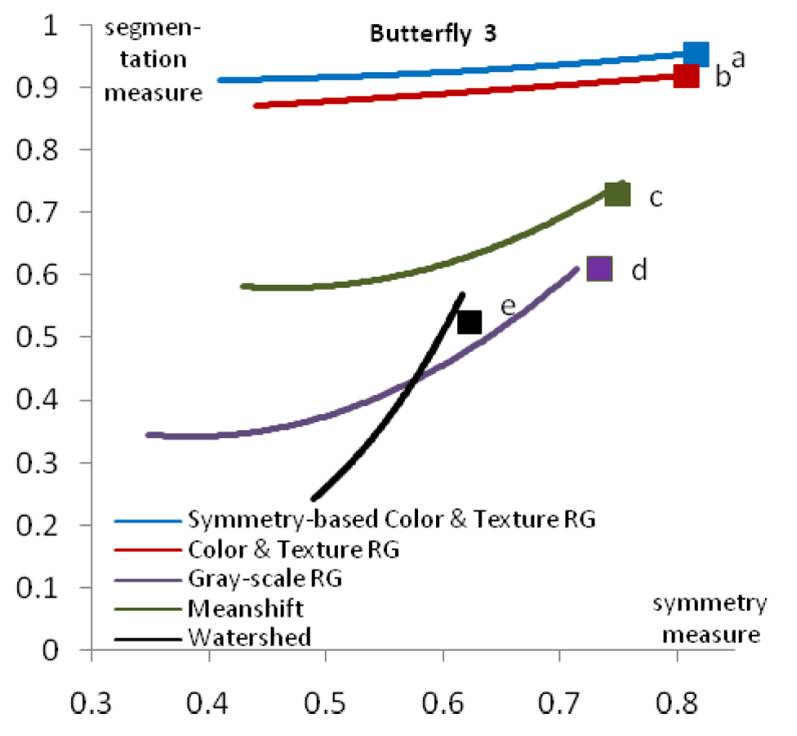
Symmetry and segmentation performance curves for image butterfly 3
The symmetry-integrated image segmentation is applied into MRI brain injury detection,
where symmetry information is applied in all the steps of injury detection system. The injury
detection system is a fully automated symmetry-integrated brain injury detection method for
MRI. Our proposed approach can detect injuries from wide variety of brain images since it
makes use of symmetry as a dominant feature, and does not rely on any prior models and training
phases. The approach consists of the following steps: (a) symmetry integrated region growing
segmentation of brain slices based on symmetry affinity matrix, (b) computation of kurtosis and
skewness of symmetry affinity matrix to find potential asymmetric regions, (c) clustering of the
pixels in symmetry affinity matrix using a 3D Relaxation algorithm. (d) fusion of the results of
(b) and (c) to obtain refined asymmetric regions. (e) Gaussian mixture model for unsupervised
classification of potential asymmetric regions as the regions corresponding to the brain injuries.
Experimental results are carried out to demonstrate the efficacy of the approach for injury
detection, and one example injury detection approach is shown below:
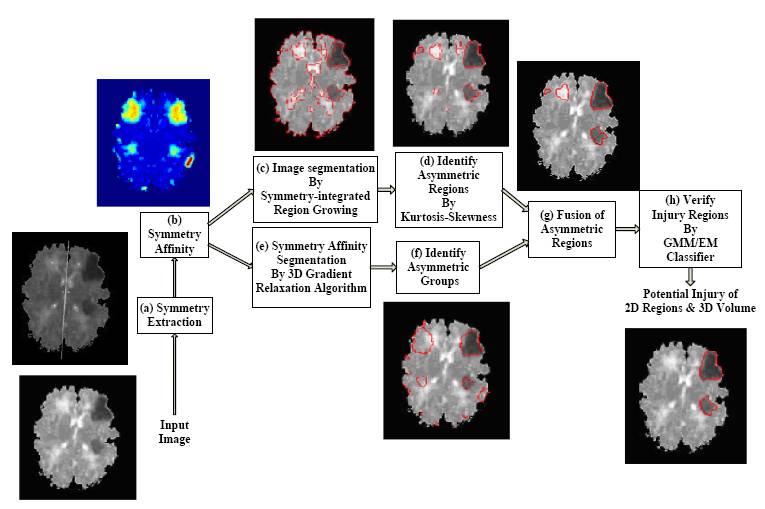
Overall diagram of symmetry-based brain injury detection system
Symmetry-based Segmentation vs. Ground-truth A Comparison
|
|
| A Sample Butterfly
|
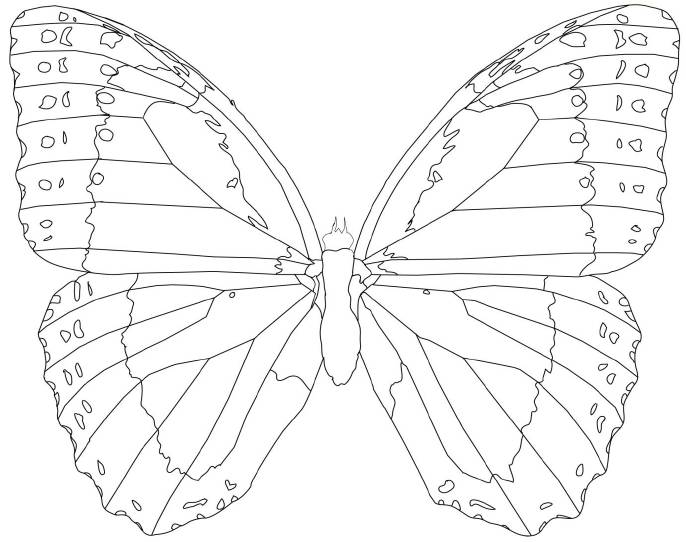
Ground-truth outline
|
|
|
| Ground-truth with boundary superimposed
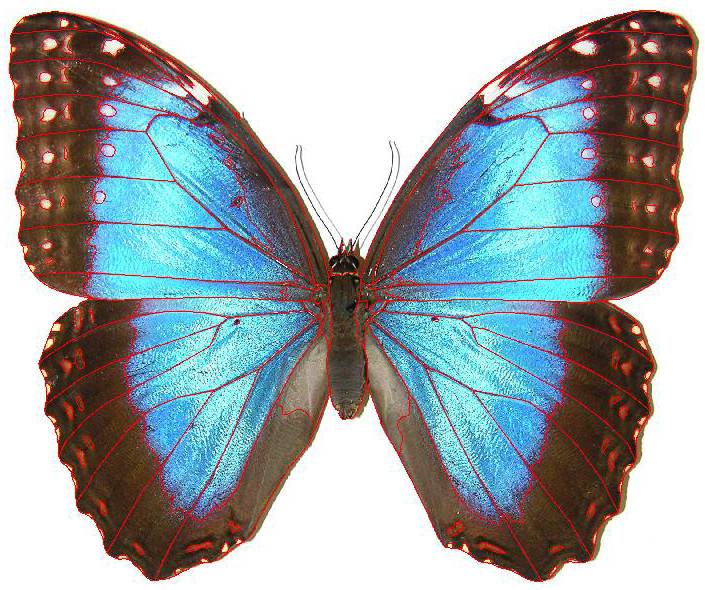
|
Symmetry-based automated segmentation with boundary
|
 Performance of Symmetry-based automated Image Segmentation
Phylogenetic Revision, Automated Taxon Identification Analysis, Project Evaluation
Elizabeth Murray
PhD Candidate
Department of Entomology
Research Focus:
I am beginning a phylogenetic revision of a genus of parasitic Hymenoptera. My research utilizes wasps in the ant-parasitoid genus Kapala (Hymenoptera: Eucharitidae), which have a distribution ranging from the southern US through South America, with at least one species in southern Africa and Madagascar. Kapala is composed of 17 species, but that number is expected to increase greatly under systematic scrutiny. This genus lends itself to an automated identification system because it has easily-visible gross anatomical features, it exhibits a high degree of morphological variability, and also, there is a large depository of specimens accessible for imaging.
I will incorporate novel taxonomic methodologies made possible through collaboration with the team of computer scientists in this project. After optimizing the system on Lepidopterans, we plan to use the wasp photos. Ive begun by capturing multiple views of Kapala specimens using an automontage system. The data set will be used as a training component for the developing automated taxon identification system that will be used to aid in both discrimination and analysis of characters, thereby assisting traditional taxonomic work.
Elizabeth Murray (Entomology PhD student with J. Heraty; start January 2008).
Elizabeth Murray is currently progressing on research involving a phylogenetic revision of a
genus of parasitic Hymenoptera. This genus Kapala (Hymenoptera: Eucharitidae) is composed
of 19 species, but that number is expected to increase to 50-70 species under systematic scrutiny.
The Kapala have a distribution including the New World (southern US through South America)
and the more recent Old World introduction (Africa and Madagascar). An extensive taxonomic
study is required to sort out cryptic species relationships and intermediacy of characters, since
there has been a deficiency of a comprehensive morphological and molecular examination.
Distinguishing this revision from traditional taxonomic work is the collaboration with the team
of computer scientists in this project. Because of this unique opportunity, Murrays doctoral
studies will incorporate novel taxonomic methodologies made possible through this
interdisciplinary partnership.
This genus lends itself to an automated identification system because it has easily-visible
anatomical features, it exhibits a high degree of morphological variability, and there is a large
depository of specimens available for imaging. The data set will be used for the development of
an automated taxon identification system that can aid in discrimination and analysis of
characters, thereby assisting traditional taxonomic work. The feature extraction system is
currently under development.
Current work and progress: Murray has been taking multiple views of specimens using an
automontage system. These images are useful both for specimen comparison and for sharing
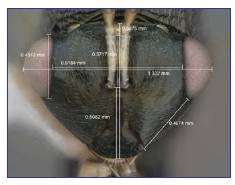
results with the scientific community (Fig. 1). Preliminary morphometric techniques are being
used to measure important Kapala features directly from images (Fig. 2). These measurements
are easily transferred to a spreadsheet and then used in analyses. Murray has completed SEMXL30
training and has practiced imaging specimens using SEM techniques.
In addition, she is undertaking molecular work to collect data to add to a multi-gene dataset
which the Heraty lab has been compiling. These molecular data will be important when
interpreting the morphological characters, and add another source of evidence when accounting
for variation. The molecules aid in determining the amount of phenotypic variation that may
correlate with species divisions. Establishing confidence in the phylogenetic relationships and
determining a hypothesis of Kapala taxonomy will inform the interpretation of the automated
taxon identification (ATI) results. In turn, classes designated from the ATI program can help to
inform taxonomists as to individuals and characters on which to focus to determine taxonomic
groupings and important features.
Murray is exploring the use of The Ohio State University Hymenoptera Online database. She
has submitted hundreds of records to the sever-based system, and these specimen data are
currently available for public use. Also, she recently began supervising a volunteer
undergraduate student who assists in recording the specimen data and is greatly increasing the
amount of information that can be databased.
Conference and Workshop Attendance:
- $600 Fellowship from Willi Hennig Society to attend: Fifth International Workshop on
Phylogenetic Methods; The Ohio State University, Columbus, OH. July 21-25, 2008.
- Paper presentation: Ant-killers of the New World: A revision of the genus Kapala
(Eucharitidae). Student Seminar Day; UC Riverside, Riverside, CA. Sept. 25, 2008.
- Entomological Collections Network National Meeting; Reno, NV, Nov. 15-16, 2008.
- The Entomological Society of America (ESA) Annual Meeting; Reno, NV, Nov. 16-19,
2008.
- Paper presentation: Ornate ant-killers conquer Africa. Pacific Branch Meeting of the ESA,
San Diego, CA, March 28 April 1, 2009.
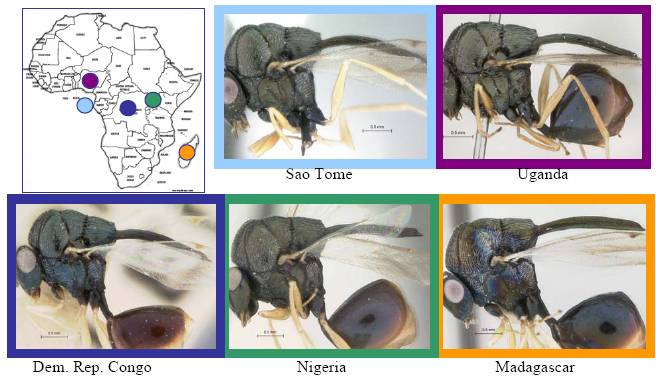
|
Morphological comparison of a small sample of Old World Kapala specimens.
Molecular and morphological evidence indicates that these are only one species, K. ivorensis.
The digital images allow for ease of comparison, measurement, and recall.
|
| View of face of a Kapala specimen from Kenya, showing the use of digital images for
morphological measurements. The identical views captured for automated taxon identification
purposes also serve well for obtaining accurate and precise measurements across many
specimens. |
|
Focus Indexing, Database Structure
Anthony Bianchi
PhD Candidate
Department of Electrical Engineering
The main focus of this research is to create an optimal indexing method for the Janzen database. Content based image recognition along with advanced indexing algorithms help to make the accuracy and speed of the system optimum. One path of pursuit is in geometric hashing, which could make the system less vulnerable to size differences and lighting conditions. Mixture of gaussians can help use optimize the speed of the system by creating equal levels for all branches of the index. The various parts of the insects allow for a part-by-part indexed search for the species. This allow for further accuracy since the parts can be checked for agreement. Various approaches to image representation have been done, but further research is being done into optimal attribute representation of images for the feature vectors using in indexing.
Research on Indexing of Image Databases
Anthony has been investigating indexing structures and related aspects of the content based
image retrieval process. The structures that have been mainly explored are structures which
support a high dimensional feature vector. These include R*-tree, SR-tree, VA-file, Mixture of
Gaussian (MOG), A-tree, and others. Several forms of the K-th Nearest Neighbor algorithm have
also been investigated to improve the retrieval process.
The first tree indexing structure that we looked into is the R*-tree. This tree structure is one of
the first multidimensional structures that has been created. It has been found that when the
number of dimensions increases the R*-tree degrades to the same retrieval time as the linear
search. The R*-tree is an improvement over the original R-tree since it reduces overlapping,
which makes the number of queries small that search multiple paths of the tree.
Another approach is based on using bounding spheres instead of rectangles, but ultimately the
SR-tree used the intersection of a sphere and a rectangle to describe the data. The SR-tree has
been shown to do well in moderately high number of dimensions (64 dimensions). In the VA-file
approach there is a similar result for moderately high dimensions. The VA-file uses global
approximation, and it does work well with linear data. But, the VA-file approach degrades when
using sparse real data. A new version of the VA-file, the VA+-file, uses Information Theory
techniques to overcome some of the VA-files drawbacks. Another indexing structure that shows
promise is the A-tree. It uses relative approximation to represent the children nodes in the tree.
This method gives about the same results as the SR-tree and the VA-file.
There are other methods that try to avoid having the high dimensional structures. They do this by
using dimensionality reduction techniques. Then low dimensional structures can be used to store
and index the reduced data. These methods show promise, but information can be lost during the
reduction process. The highly similar biological images in our database may not be able to
handle any loss in information. A good example of these methods is the Bag of Words technique.
In this approach thousands of features are computed, and these features are mapped to a
sentence. Then word matching techniques are used to find the closest matching data.
Originally, we tried a standard Nearest Neighbors (NN) search using 15 feature dimensions on a
limited butterfly data. Most of the features were color features and moments of inertia. The
precision from this testing was around 85%. Next, the images were manually segmented and had
their features calculated. In the next test, we used the NN algorithm on each part where the parts
vote for which species the images belonged. The precision on this test was 100%, but the time
for retrieval was five times more. Note that this was done with a small dataset of butterflies.
Currently, tests are being setup to compare the above algorithms in a systematic manner on a
dataset of 35,000 butterflies. We are hoping to find the strengths and weaknesses of each of the
techniques. By doing this we hope to gain insight into developing a new technique for indexing
high dimensional data of highly similar images like butterflies. This has not been done before.
Focus Indexing, Database Structure
Philip Vuong
Department of Computer Science
Combining Image Databases and Image Retrieval
Today, most current image retrieval systems call upon a single search to retrieve the
images that are most similar. Mostly they use simple learning algorithms such as K-nearest
neighbor, using weights to determine if the image looks similar or not. However, not all images
look the same or can be categorized in the same way and many images though they may look
similar have many varying features that tell them apart, for example, species of insects. In this
paper I will present work done and steps taken to combine image databases and image retrieval
software.
1. Introduction
Around the world, many image libraries and databases are viewed from a day to day basis.
To search through most databases for images, all that can be provided is a set of keywords meant
to describe the image. However, what if the image keywords we have arent correct, or arent
perfect? How do you refine your search? And what are the implications of the search?
By just using words to process data, there are many different problems. First we must
identify that each image in a database is correctly labeled and placed with the correct keywords
to be included in a search. However, that leaves a lot of ambiguity with what images can be
returned to us. Searching for a cat, for example, could lead to lots of definitions, from comics to
art of cats.
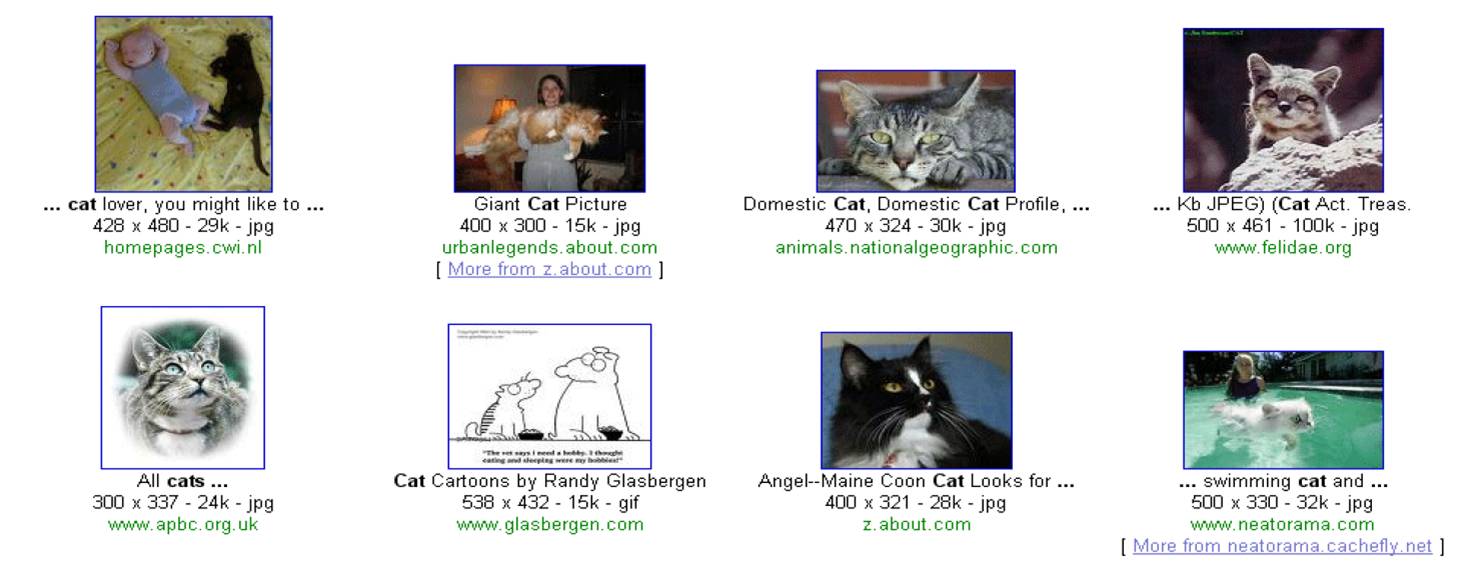
A google search using the cat keyword. As we can see it brings up comics,
portrait pictures, and other keywords.
How do we refine our search from this? We could add extra keywords that add to and
restrict the search further, but what other results could come from this? The problem comes
from trying to identify our main subject and what exactly we are trying to define that identifies
the image as that image. So, we must use relevance feedback to gain a better understanding of
why the image is defined as that image and what other images should match.
2. Image Databases and Interfacing with Users
First, we were tasked to use a specific image database given to use which contained 35000
images of butterflies of varying species, families, and ecosystems. However, we quickly came to
a problem. The image database must first be converted from the given type, FileMaker Pro, to a
more accessible type that works easier with SQL and relational programming, Microsoft Access.
To do this we used the features inside FileMaker Pro to create a script that would allow the
extraction of all image data from the FileMaker database.
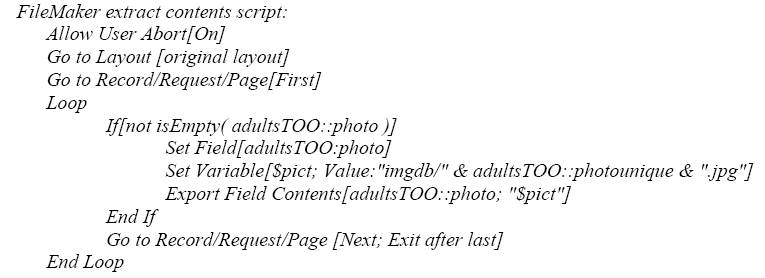
Script for extracting images from the database.
After successfully exporting all of the image data from FileMaker, we then used a built in
function to export all of the field values. We were then able to create a new database by using
Microsoft Access. By importing tab delimited files into Access we were able to copy all of the
relevant data. Each image was already assigned a unique ID inside the database and, thus, that
key was used as a primary key. Each image is stored in a separate file from the database and the
program uses pointers to call each image given the specific ID from the database.
After tying in all of the information provided from the database, we then created a new table
in the database and inside that table, stored all of the feature vectors of the image. With this
database now holding all the necessary information, we will write the program that will interact
with the database, perform all the necessary searches, take in feedback, and display the search
images.
3. MFC Interface and Other Tools
Given that we were programming in Visual C++, an easy choice for interface programming
was to use MFC, or Microsoft Foundation Classes. Using MFC it gave us a simple way to
interact and create the interface. So with that, we were able to create a simple interface with all
the necessary controls to control the program. By finding many tutorials on MFC it became very
simple to create the interface, get user input, and overall write the program. However, as with all
new languages and added tools there comes a hitch.
My first problem came when there was no simple way to implement Picture Controls
(buttons with a picture face) in MFC. After much search, we found a similar plea for help and
that someone had created a MFC picture control script that used the MFC base classes. Using
the files that were provided we were able to pull it all together and implement a picture control
function which would be the basis for relevance feedback.
For testing purposes and other sub tools that we wrote to test the program from early builds
to later builds, we needed a simple way to traverse directories, that way we could cycle through
images to test other functions. C++ is a diverse programming language, but does not have many
directory or file traversing functions. In order to implement these needs, we decided to use the
commonly used Boost Filesystem. By installing Boost and correctly including it into the
program, we had a simple way to traverse and iterate through every file in a given directory or
directories. Thus we could simply read all files which would be useful for our tools that would
create feature vectors.
Lastly we needed to find which database connectivity would serve our purposes in regards to
the database. We had two choices Open Database Connectivity (ODBC) and Active Data
Objects (ADO). After many tests through both ODBC and ADO coding, we found that it would
be easier to access the database through ADO coding as we can leave the database file alone and
access it as it were. This allowed us to make the program even more stand-alone as it would
not need to remotely connect to any hosted database or things like that.
After finding all the tools necessary to combine into a package, we are able to write a
program that showcases all of the work we have currently done.
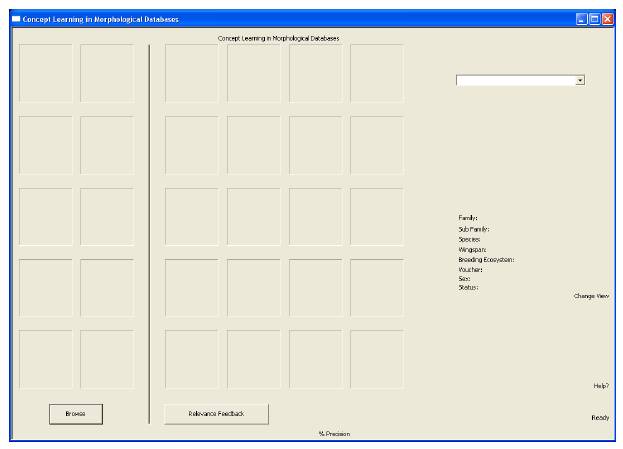
The program interface ready to be used.
4. Relevance Feedback
4.1 Simple K-Nearest Neighbor Testing
For the program, we decided to implement Simple K-Nearest Neighbor as the primary search
to allow users to browse the database. Simple K-Nearest Neighbor (simple k-nn) is a simple
machine learning algorithm that searches through a set of data and returns the closest neighbors
based on the combined Euclidean distance of each feature dimension that the neighbor has. The
reason why this is very useful for us is that it creates continuous and overlapping neighborhoods.
We can then use a neighborhood for each query, making all points in any single neighborhood
close to the search we provided.
Using the simple k-nn as an image retrieval search would simply return the K closest images
to us. In the case of this program, we wanted to return the twenty closest neighbors for
inspection. We already know that if we use simple k-nn we will not receive any weighted
features and that is usually problematic for searching across an image space. But that is not the
function we want to use it for. We only want to display the twenty closest images, and by using
Relevance Feedback we will allow the user to select the images that will relate to a weight and
feature relevance instead of trying to automate the relevance.
By writing a naïve and simple k-nn that uses standard template vectors to store and compare
the feature vectors of the database, we are able to create the functionality needed that would
display to users a basis of their results. The data from the database is loaded into a vector and
then passed into the simple k-nn algorithm which returns the twenty closest images. The
program loads the images and from there the user provides relevance feedback to the program by
selecting images that should have not been included in the original query.
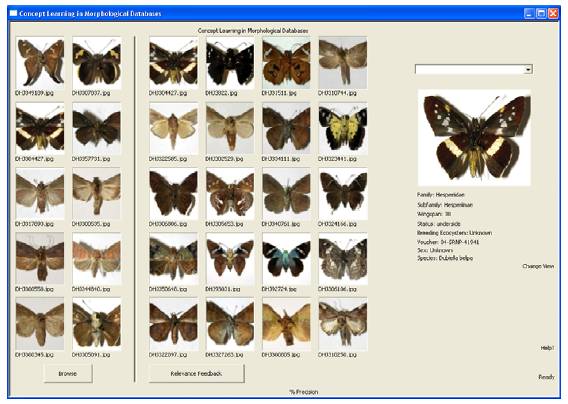
The program running a simple k-nn and displaying the results.
4.2 Learning Weights of Features Using Relevance Feedback
Relevance feedback is the simple idea which takes the results of a given query and using the
information about the query can check if the results are relevant and return a more refined
search. There are three different types of relevance feedback: explicit, implicit, and blind
feedback. In our program we use explicit feedback, trusting the user to give feedback that will
help the system instead of for the users own needs.
We call the feedback explicit, because the users must specify relevance based on the search
parameters and are knowingly doing so. The user knows that the selections he or she makes will
be used to refine the search further to give a better understanding of what they would like to
search out.
We implemented the relevance feedback feature in a way that the user knows that the outliers
that they choose will not be used for weighting the features in the next search. Selection for the
users is simple and more picture controls allow the user to simply click or un-click their
selections for the relevance feedback. Pictures that are not clicked are then used for a weighted
k-nearest neighbor algorithm in which the search is refined.
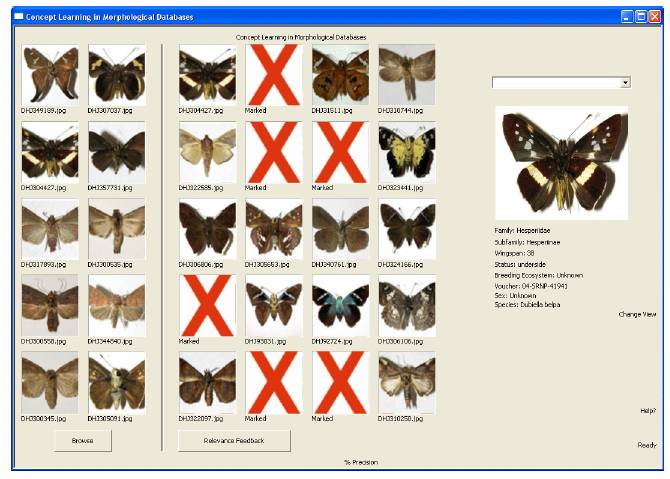
Explicit Relevance Feedback.
4.3 Weighted K-Nearest Neighbor
Weighted K-Nearest Neighbor (or weighted k-nn) is an algorithm that adds onto simple k-nn
by now multiplying each distance with a related weight, making the distance seem farther or
closer dependant on how much weight the distance is given. Weighted k-nn takes the feedback
given from the user and then creates weights for each feature dimension based on the images that
were not removed from the search. (J. Peng, B. Bhanu, S. Qing, ''Probabilistic feature relevance
learning for content-based image retrieval,'' Computer Vision and Image Understanding, Vol 75,
No. 1/2, pp. 150-164, 1999.)
To implement this, we simply added on to our simple k-nn to introduce a weight variant. For
simple k-nn the weight is not included since all of the features should be the same, however, for
weighted k-nn we take in what features we do not use and perform a search on each single
dimension of the image. By dissecting the original image query per dimension instead of taking
in the whole image, we can then determine if any of the other images in the search that were
included from relevance feedback match in that feature dimension, thus giving us a relevance
and weight.
By writing a few functions we are able to calculate the weights per feature and then include
them into the weighted k-nn search. The distances that are calculated are then weighted,
changing them to be closer or further from the original query, thus giving us a better look at what
it is that the user and system wants.
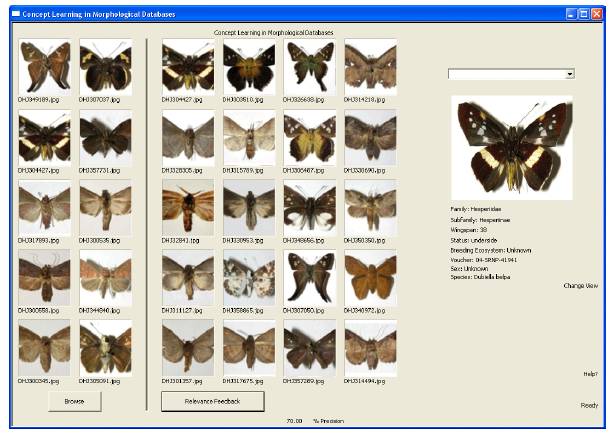
The search after using weighted k-nn.
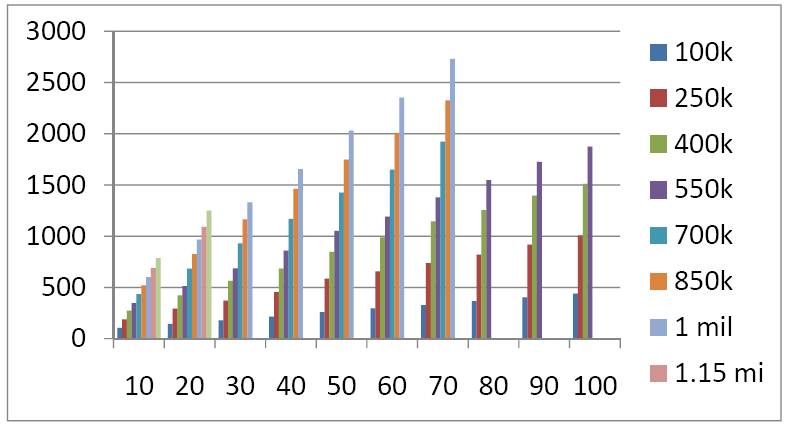
4.4 Testing of Prototype System
The program itself runs into many limitations. Simple K-nearest neighbor is very computationally
intensive, requiring that the feature vectors be stored during the load time into memory so as to
prevent from long run times. However, we see that using that method, we will run out of physical
and virtual memory that the computer can store, causing the program to not have any more memory to
allocate and crashing. (Note that it will serve as the baseline approach with which we will compare the
improvement in performance using the indexing structures described elsewhere in the report). For the
baseline results, see Figures 7-9. For very large databases and large feature dimensions, the time was
excessive and all the experiments are not carried out. The program currently has many limitations.
First. Naïve programming has the program storing a lot of data into memory. By changing the algorithm
or by pre-computing lots of the data, the program can run a lot more efficiently and use a lot less
memory. However, this problem cannot always be solved. When doing feature relevance and weighted
k-nearest neighbor, the data must be loaded into memory since the features must be viewed and their weights
changed. This still means that a lot of data will be stored into memory unless we wish the run time to
be O(2n2), where n is the time it takes to access each feature variable through the database. On a small
dataset this is fine, however on a large dataset (we wish to let this program run on a 100 million image
database) the run time grows too large to be reasonable.
Second. If we want to store all of the data into memory, we will run out of memory when it comes down to
the number of features to store. For our goal, we wish to have 100 million records with 100 features
each. Considering that each feature is a 32 bit value, then we must store at least 320 trillion bits,
or 40 trillion bytes. That is a massive amount of memory to store.
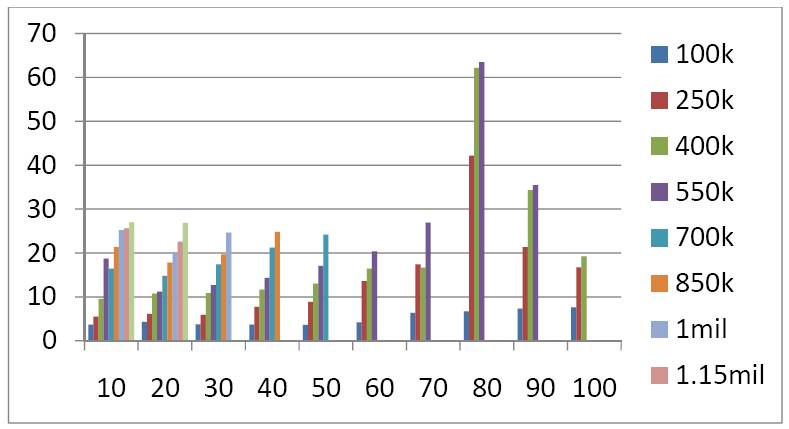
Simple K-Nearest Neighbor run times (time taken (y-axis), in seconds vs. number
of features, x-axis).
Finally. The run time of the algorithm goes up linearly, and for a user interactive program, we want to
make that linear time to be as small as possible. Currently at high enough values, within our testing
data, the program can take nearly a full minute to run. We need to cut this down a multitude of times
such that the program can be more user friendly.
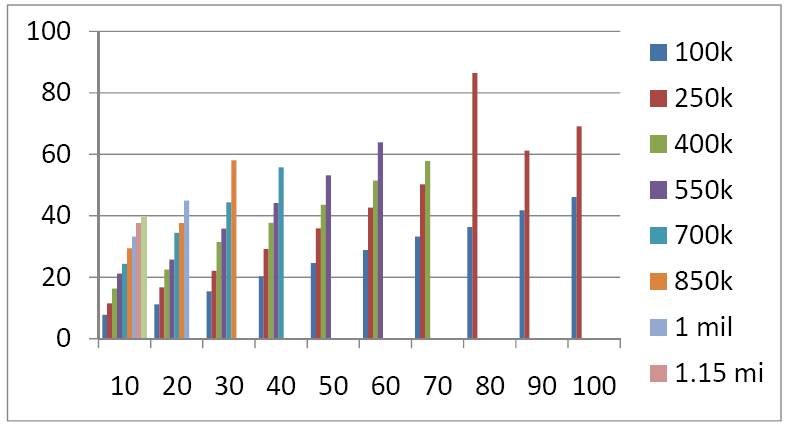
Weighted K-Nearest Neighbor run time (time taken, in seconds
vs. number of features).
Load times for the program (time taken, in seconds vs. number
of features).
5. Future Features
Currently the work is very preliminary and nowhere near to completion of what we want. In future revisions
we hope to make the program more user friendly, adding in more search functions and feature selection tools
to make the searches as accurate and as close to what the user wants. In the future, we would like to
implement more features that relate to how the user can correspond with the efficient indexing structures
under development and the k-nearest neighbor algorithms.
More user interactions could also include an easier browser function which could allow users to browse and
search only certain types or categories of pictures. This will allow the user an easier way to access only
images they want to search and give relevance for. Also, perhaps a gradient scale for the relevance
feedback may be appropriate. Things that have been discussed to enhance the program are: more info on
picture, ability to zoom, feature selection on demand, more search restrictions, inverse relevance
feedback (click correct instead of outliers), display top vs. bottom views and other available views,
allow for multiple queries, allow for weight changes, link to morphbank, and cross platform or web
applications in the future. Font names, design backgrounds, and other things will be implemented at a later
time once the core program is working successfully with a large dataset.
We have gone through extensive searches to find a larger dataset in which we could test our algorithm
against. After many searches we came across a database used by MIT which held over 70 million images.
After contacting MIT we were able to get their database and add it to our own, giving us a number of about
80 million images to date. Our goal is to demonstrate image database retrieval results and object
recognition on a database of 100 Million images.
After a few errors with Microsoft Access it became apparent that Access was not the program that we wanted
to use to store our database. We discovered that Access has a table limit for 1GB, and a file size limit
of 2GB. With 80 million records, Access would not be able to hold enough information. We decided then to
switch to a new system. Looking for some well documented SQL servers, we examined MySQL. After installing
it and testing it, we decided to use it since it does not have limitations on its table or file size. We
are currently running scripts that will input all of our image sets and feature files into the MySQL
database. After that, we plan to move the database to a newer machine (switching from 3GB of RAM to 24GB
of RAM), so that we can hopefully fully test our algorithms. We will use MySQL++ to interface with the
MySQL database.
Point Matching, Database Management, Programming
Cameron Allen
MS Student
Department of Computer Science and Engineering
Research Focus:
Camerons focus on this project is managing the Janzen databases, doing an analysis on species within this database such as relationships between species that differ morphologically yet are similar in DNA and those that are similar morphologically yet differ in DNA. He is researching point matching algorithms to lend multiple solutions to accurate pattern classification and will be programming the GUI and applications that will add accessibility to the project.
Publications and Products
- Bir Bhanu, Rui Li, John Heraty, Elizabeth Murray, "Automated Classification of Skippers based on Parts Representation", American
Entomologist, p. 228, vol. 54, (2008). Published,
- Y. Sun and B. Bhanu, "Symmetry Integrated Region-based Image Segmentation", IEEE Computer Society Conference on Computer Vision and
Pattern Recognition, Miami, FL, p. , vol. , (2009). Published,
- Y. Sun, B. Bhanu and S. Bhanu, "Automatic Symmetry-integrated Brain Injury Detection in MRI Sequences", IEEE Computer Society
Workshop on Mathematical Methods in Biomedical Image Analysis (MMBIA), held in conjunction with CVPR June 2009., p. , vol. , (2009).
Published,
Project Website
http://vislab.ucr.edu/RESEARCH/Concepts/
Research and Education Activities
The focus of this research is to develop fundamental techniques and software tools for the representation and manipulation of images to help the
understanding of evolution and classification of biological organisms. The major goal of our proposed research project is the development of a
formal framework for morphological image databases, which automatically extracts appropriate visual features from images, allows user
feedback, exploits the accumulated meta knowledge, effectively learns visual concepts for different insect species, efficiently manipulates
database entities, and significantly improves the image retrieval performance. The proposed theories and associated techniques will be
validated by performing scientific experiments on multiple databases using a variety of quantitative performance evaluation measures. The
project involves an interdisciplinary team and a close collaboration between biologists and computer scientists and interactions with several
other biologists (from the University of Pennsylvania and the University of California at Riverside) who are interested in this effort and who
work manually with insects. Their expert knowledge will be incorporated in our computational framework, interface and experiments. Initially
these biologist (and later other biologists from around the country) will help evaluate the quality of results and the usefulness of tools that are
developed.
The project team consists of Professors Bir Bhanu and John Heraty and graduate students Elizabeth Murray (Ph.D. Student in Entomology), Yu
Sun (Ph.D. student in Electrical Engineering) and Cameron Allen (M.S. student in Computer Science and Engineering). Sun started work on the
project in October 2007 and Murray and Allen started in January 2008. We made special effort in recruiting these students. They have strong
interest in both entomology and computing sciences. In addition, Rui Li (Ph.D. student in Electrical Engineering) also participated in the
project. Since January 2009 Allen has left UCR and we had to recruit Philip Vuong in March 2009.
The team met regularly and discussed research ideas, papers, progress and action items. The interdisciplinary team members learnt from each
other by presentation and discussion of most of the chapters in a newly edited book, entitled Automated Taxon Identification in Systematics ?
Theory, Approaches and Applications by Norman MacLeod, CRC Press, 2007. There is a good cooperation going on among the team members
as reflected in joint publications.
For further details please see the Activities and Finding files.
Training and Development
The interdsciplinary team members with backgrounds in Biology, Entomology, Computer Science and Electrical Engineering learnt from each
other during the course of paper presentation, paper and research discussion, and doing the course work. They developed oral and written
communication skills, and skills in handling of bological problems and approaches and microscopes. They developed an appreciation and
understanding of basic elements of image processing, computer vision, pattern recognition, programming, and image databases.
Project Impact
In the world of biological science there are countless ways to aquire images and information. This process has caused an explosion of taxonomic images with no system to organize or analyze the data. In order for a specimen to be identified, detailed analysis is required by experts in its respective field. With data aquisition at a much higher rate than classification, a solution is desperately needed. This project seeks to solve one of biology's greatest problems today through automatic taxon identification. The first step in this process is to utilize the Janzen ACG butterfly database consisting of some 38,000 butterfly images. Once a effcient identification and classification system is created, the solution will allow the user to analyze results and improve methods through expert feedback, eventually scaling the solution to other applications.

Figure - Example of the Learning System
Area Background
Area References American Entomologist
Potential Related Projects
Acknowledgement
This material is based upon work supported by the National Science Foundation Grant No. 0641076. Any opinions,
findings, and conclusions or recommendations expressed in this material are those of the author(s) and do not necessarily
reflect the views of the National Science Foundation.
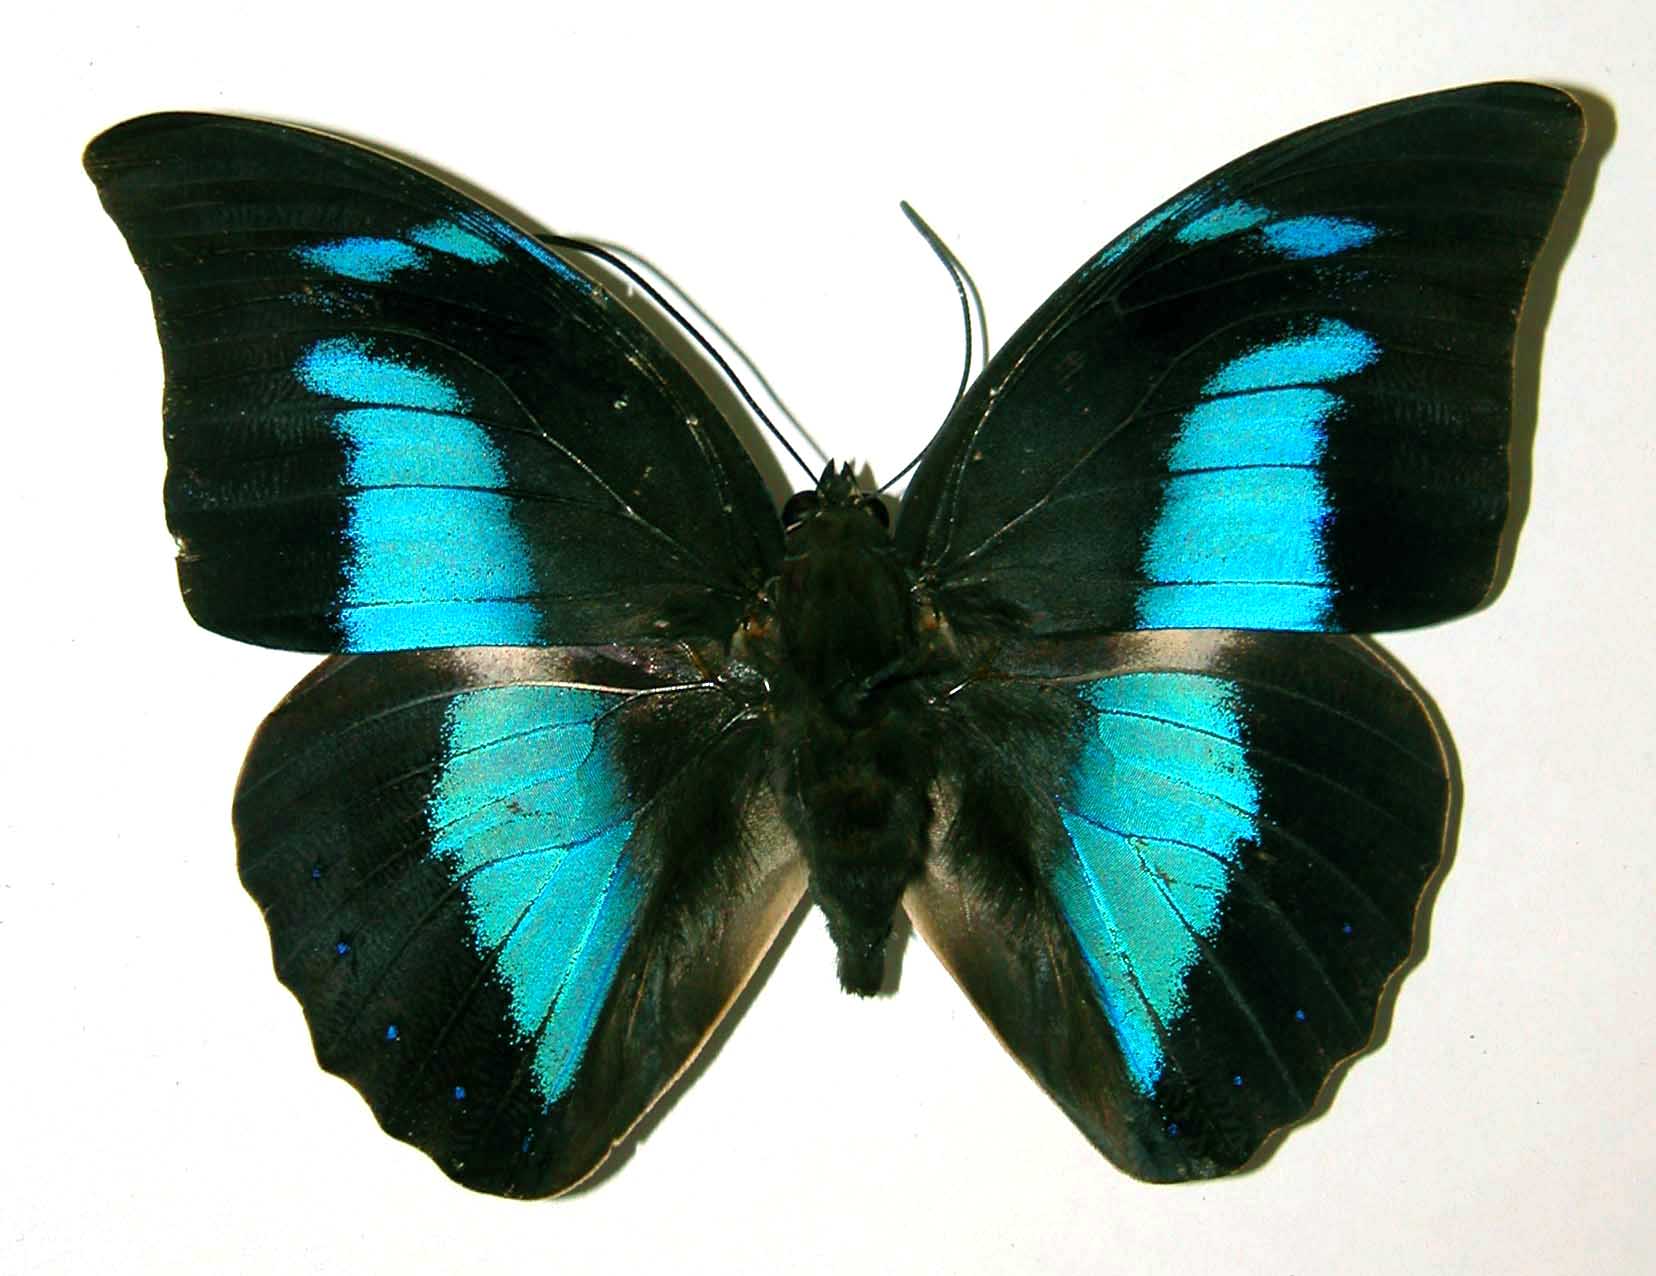
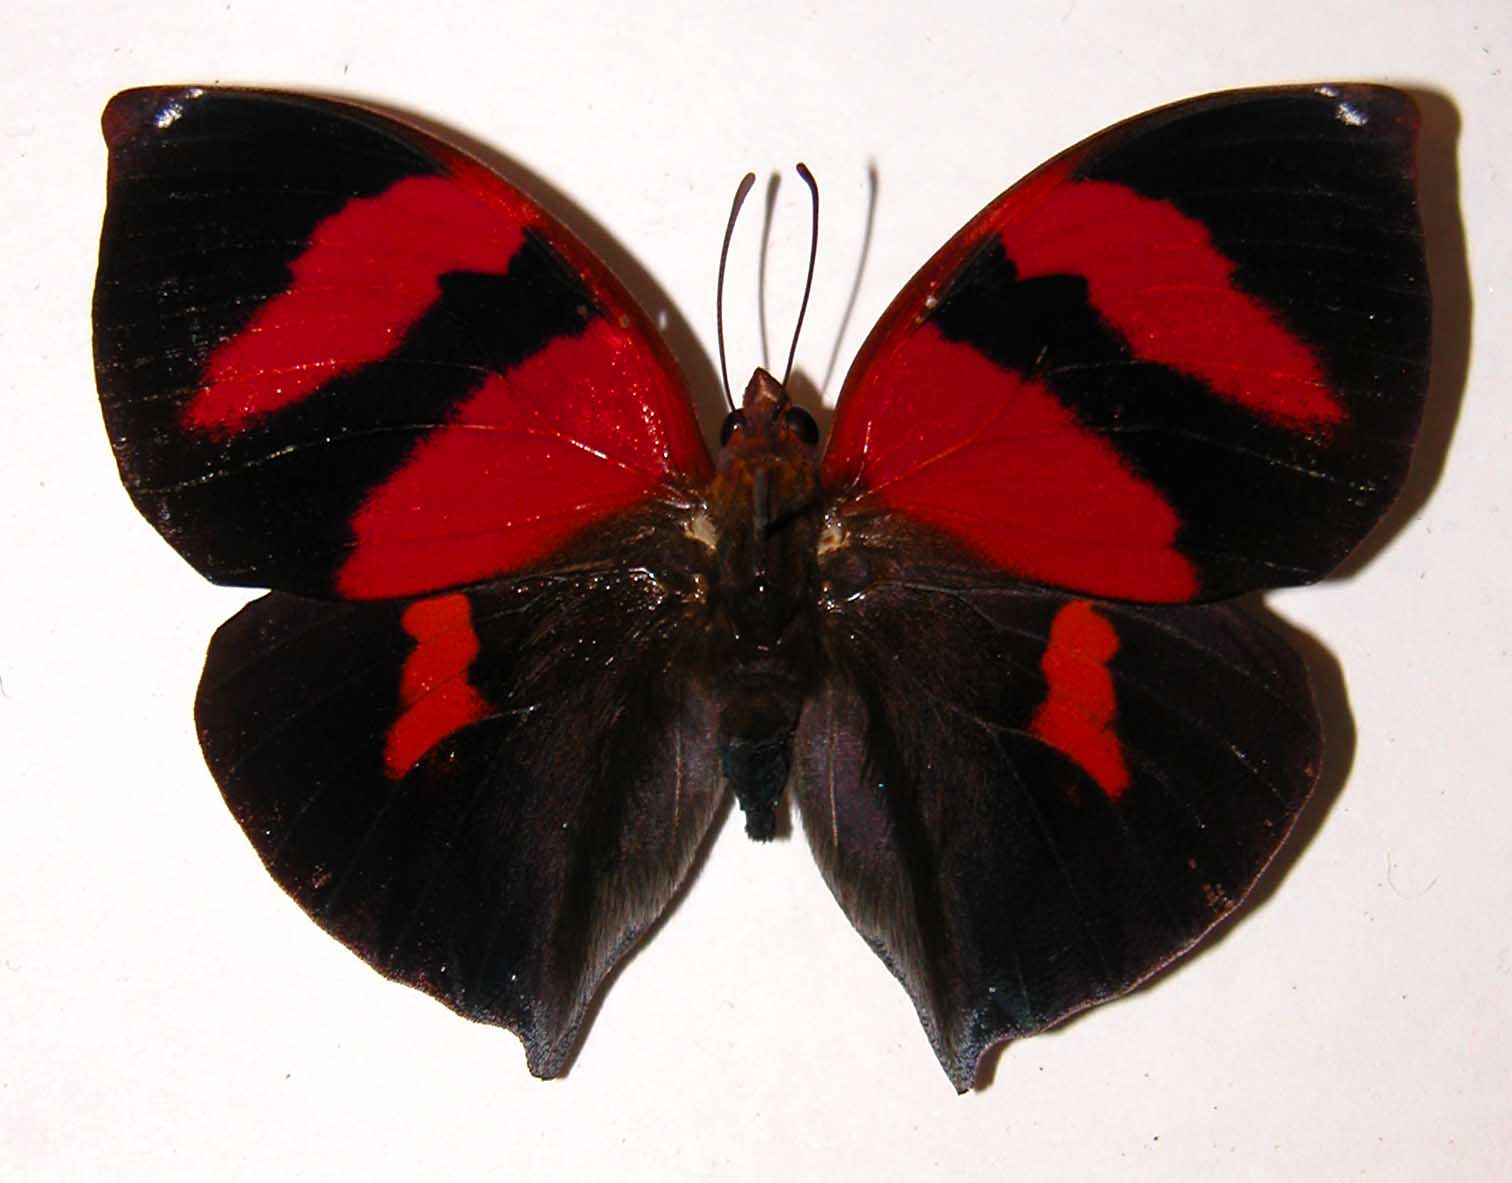
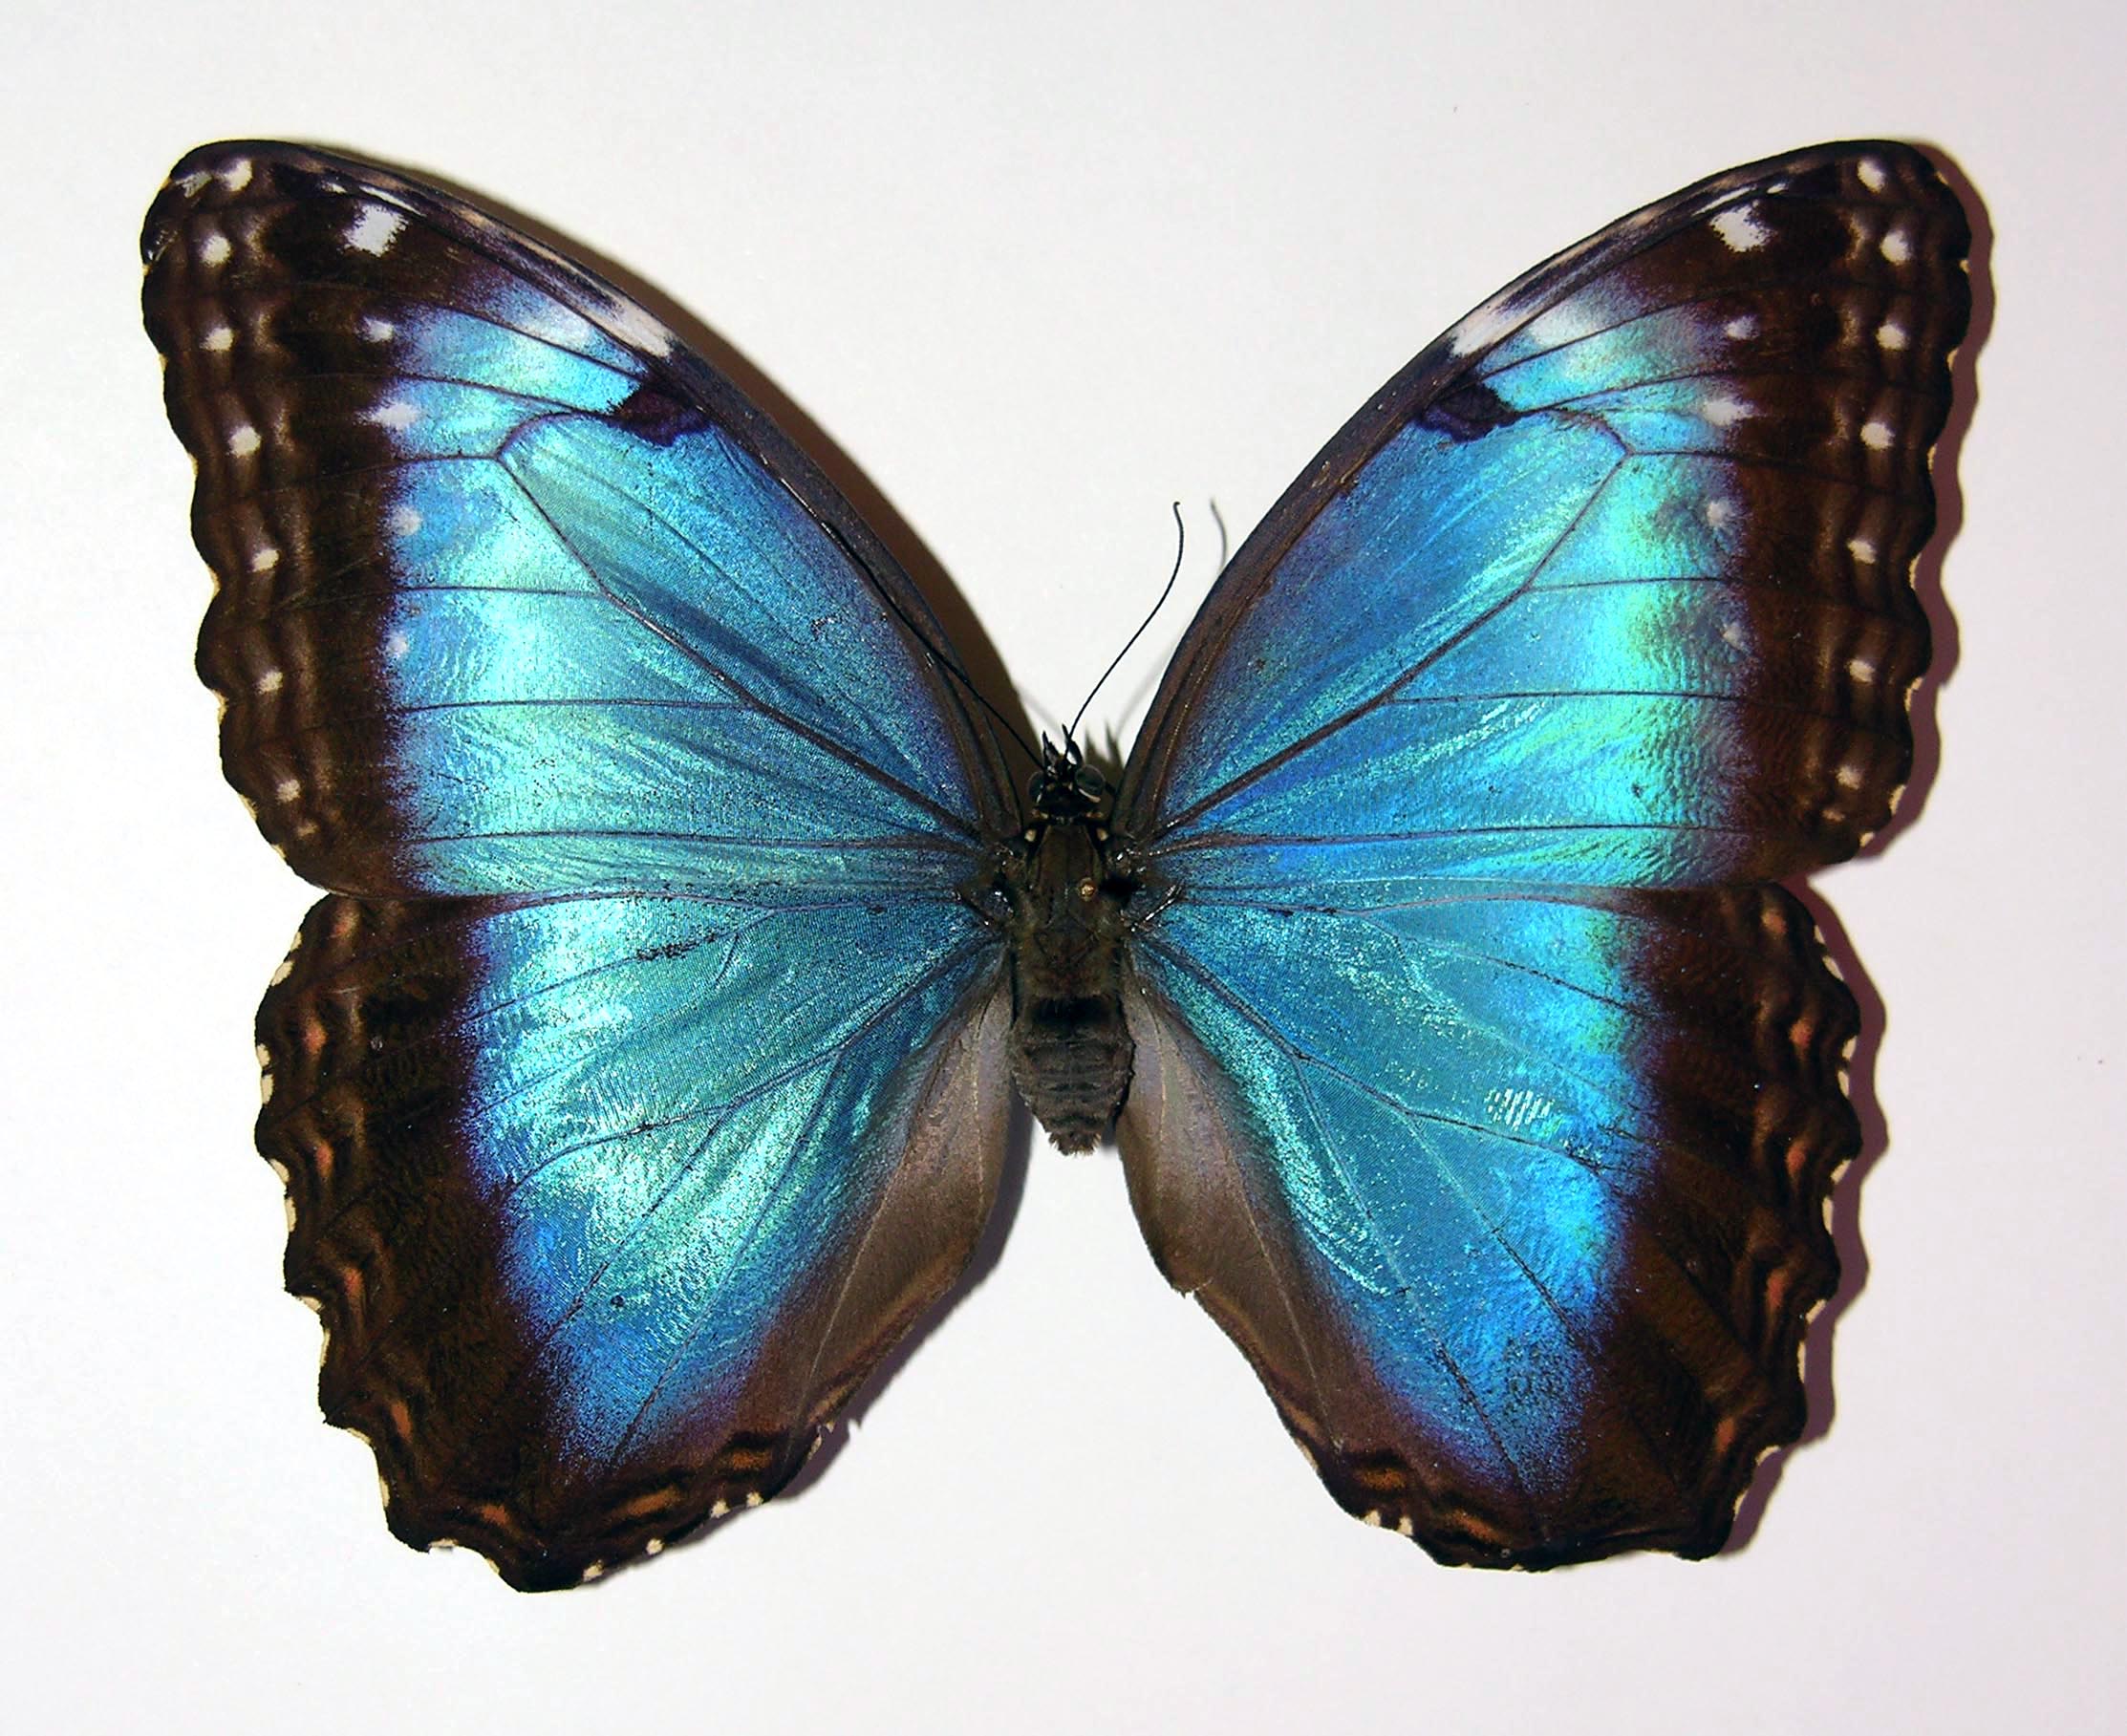
Sample Image Databases Under Investigation
Butterflies
|
|
|
|
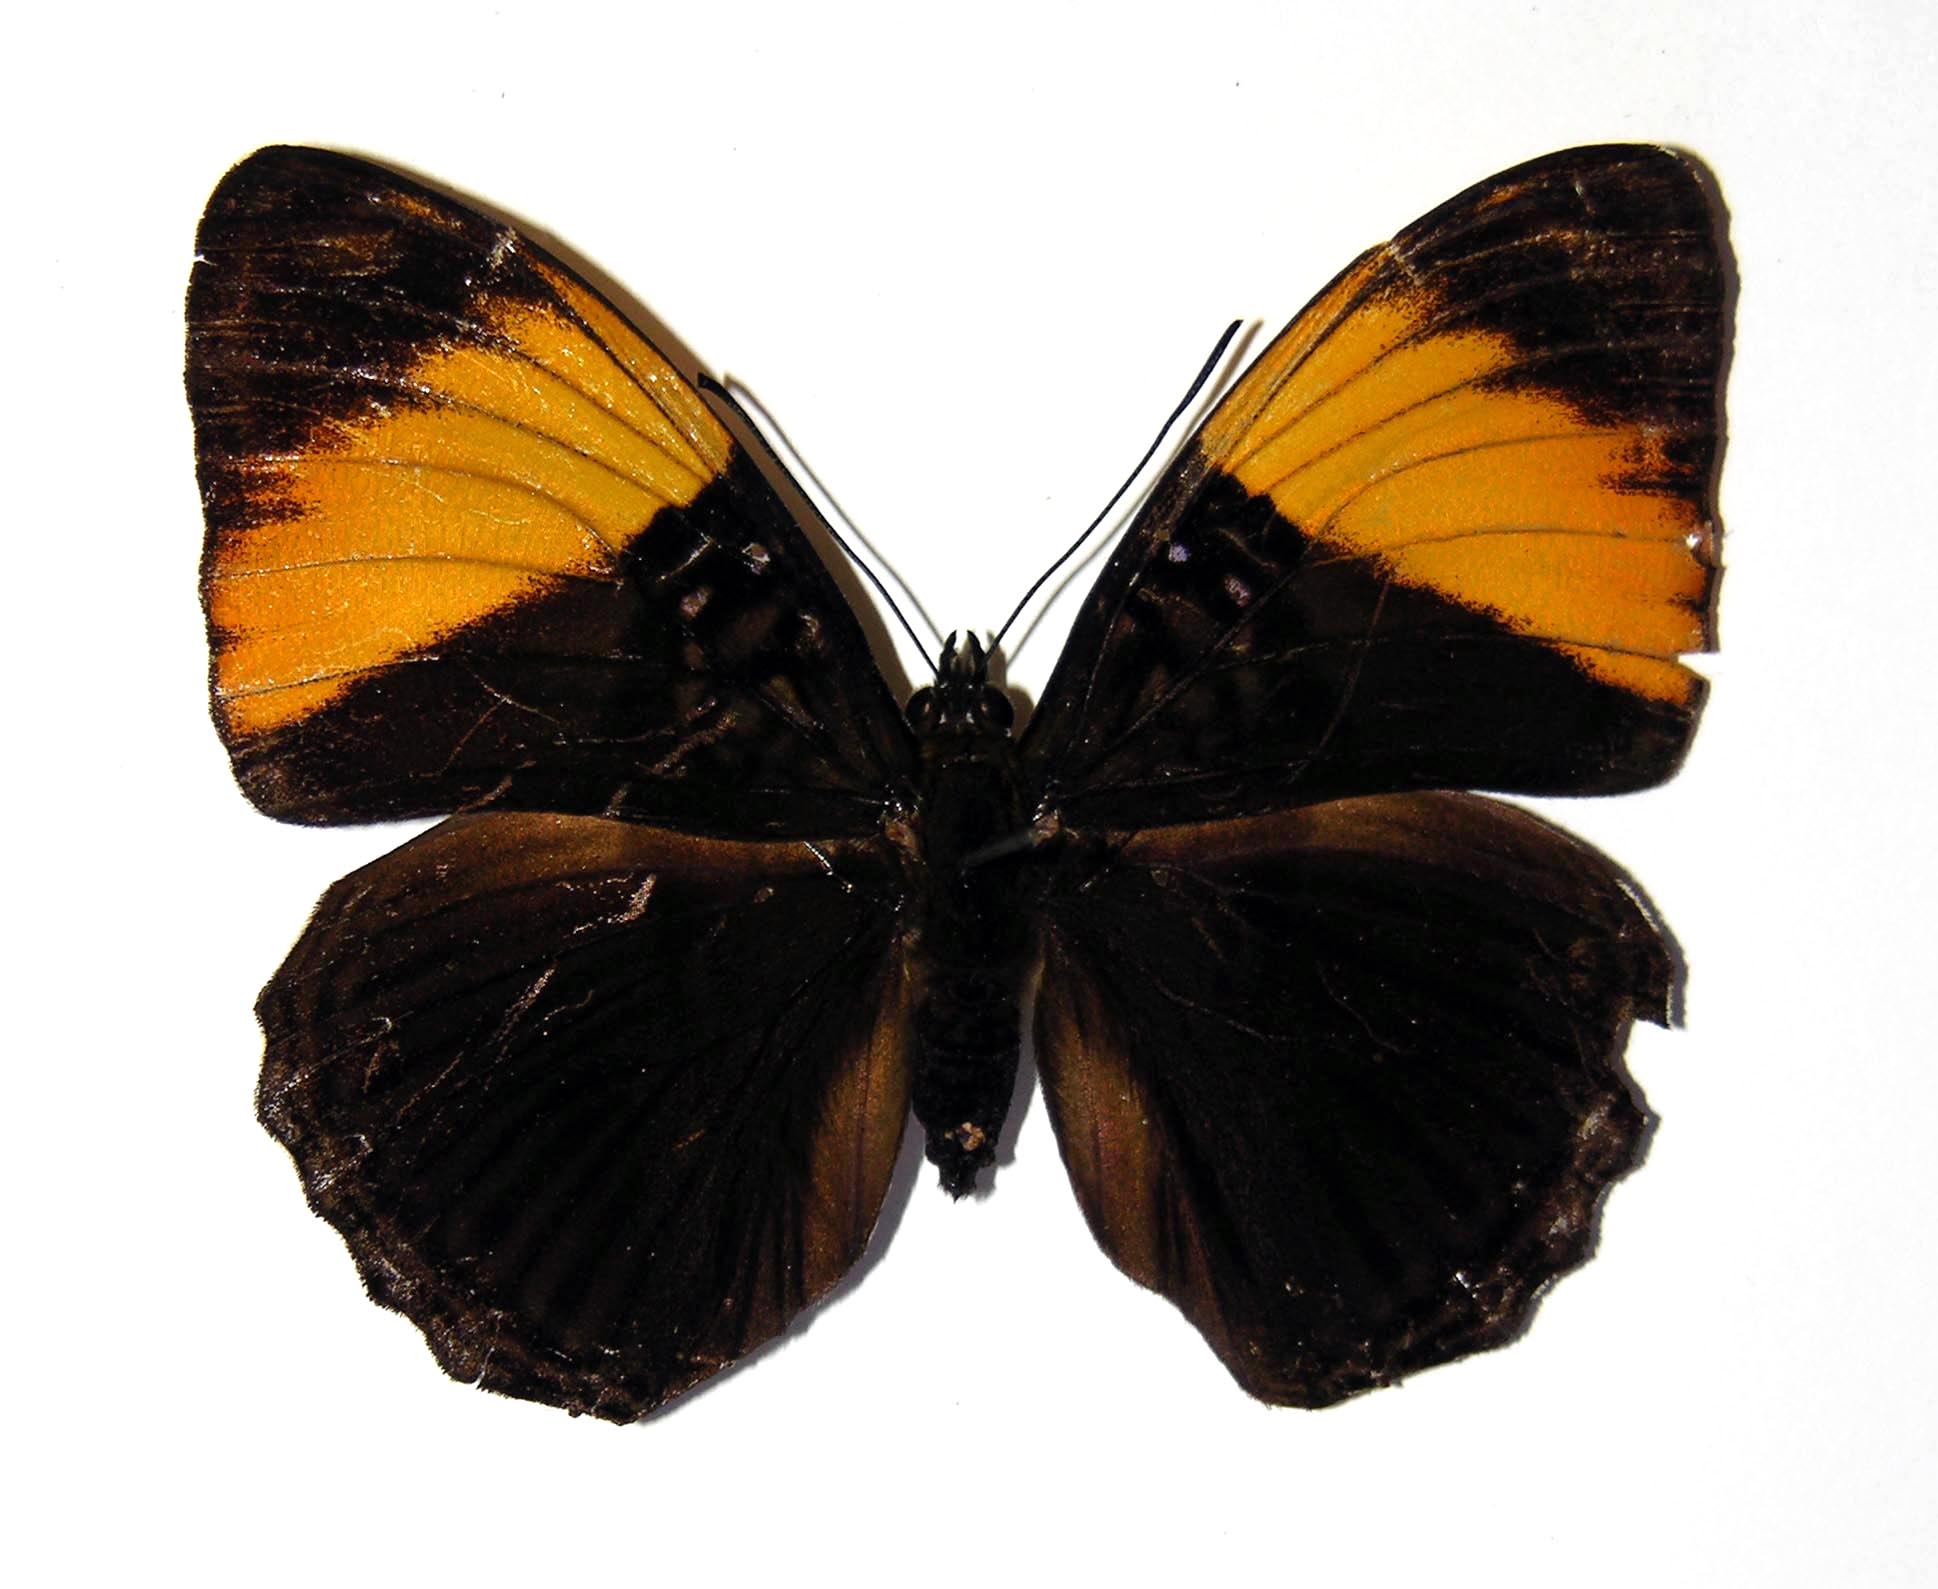
Adelpha Melanthe
|
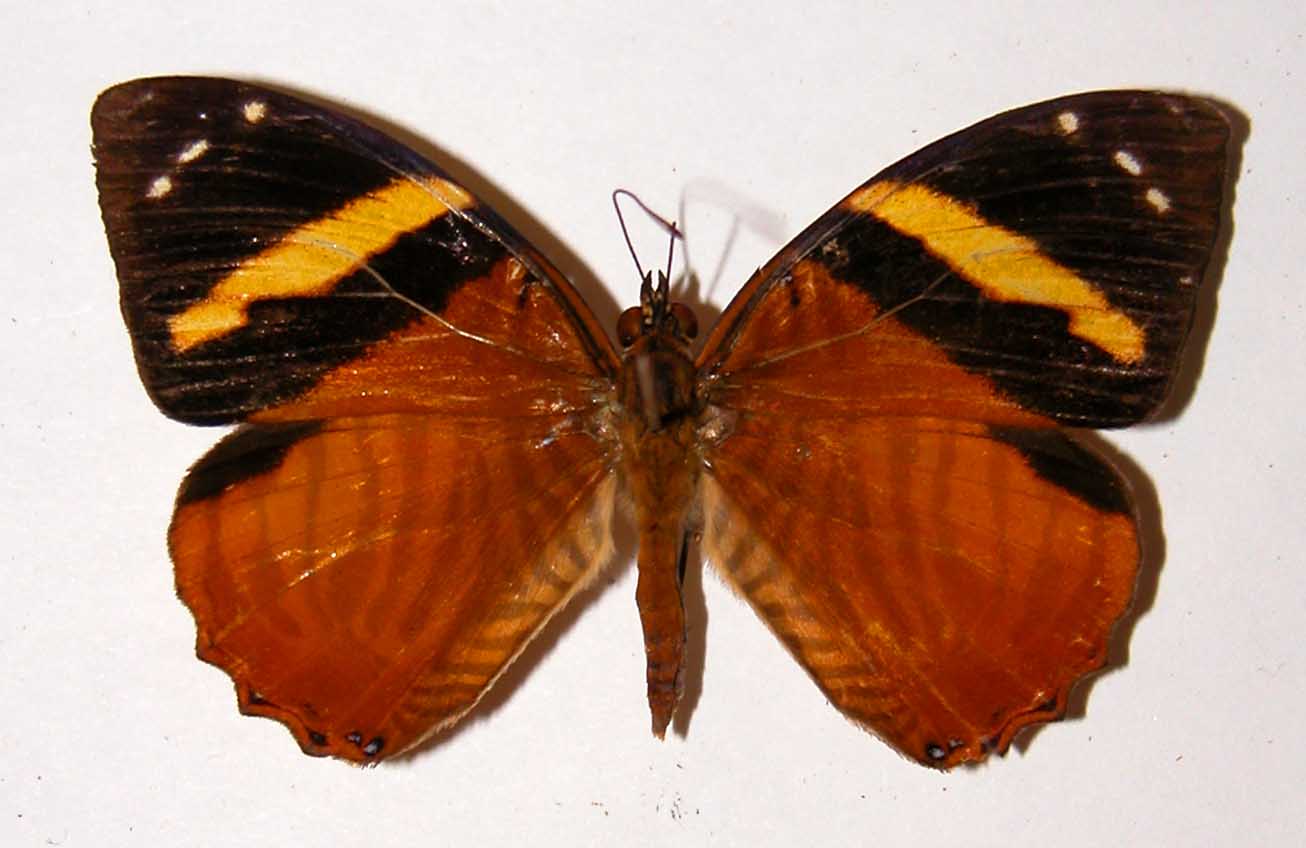
Adelpha Zina
|
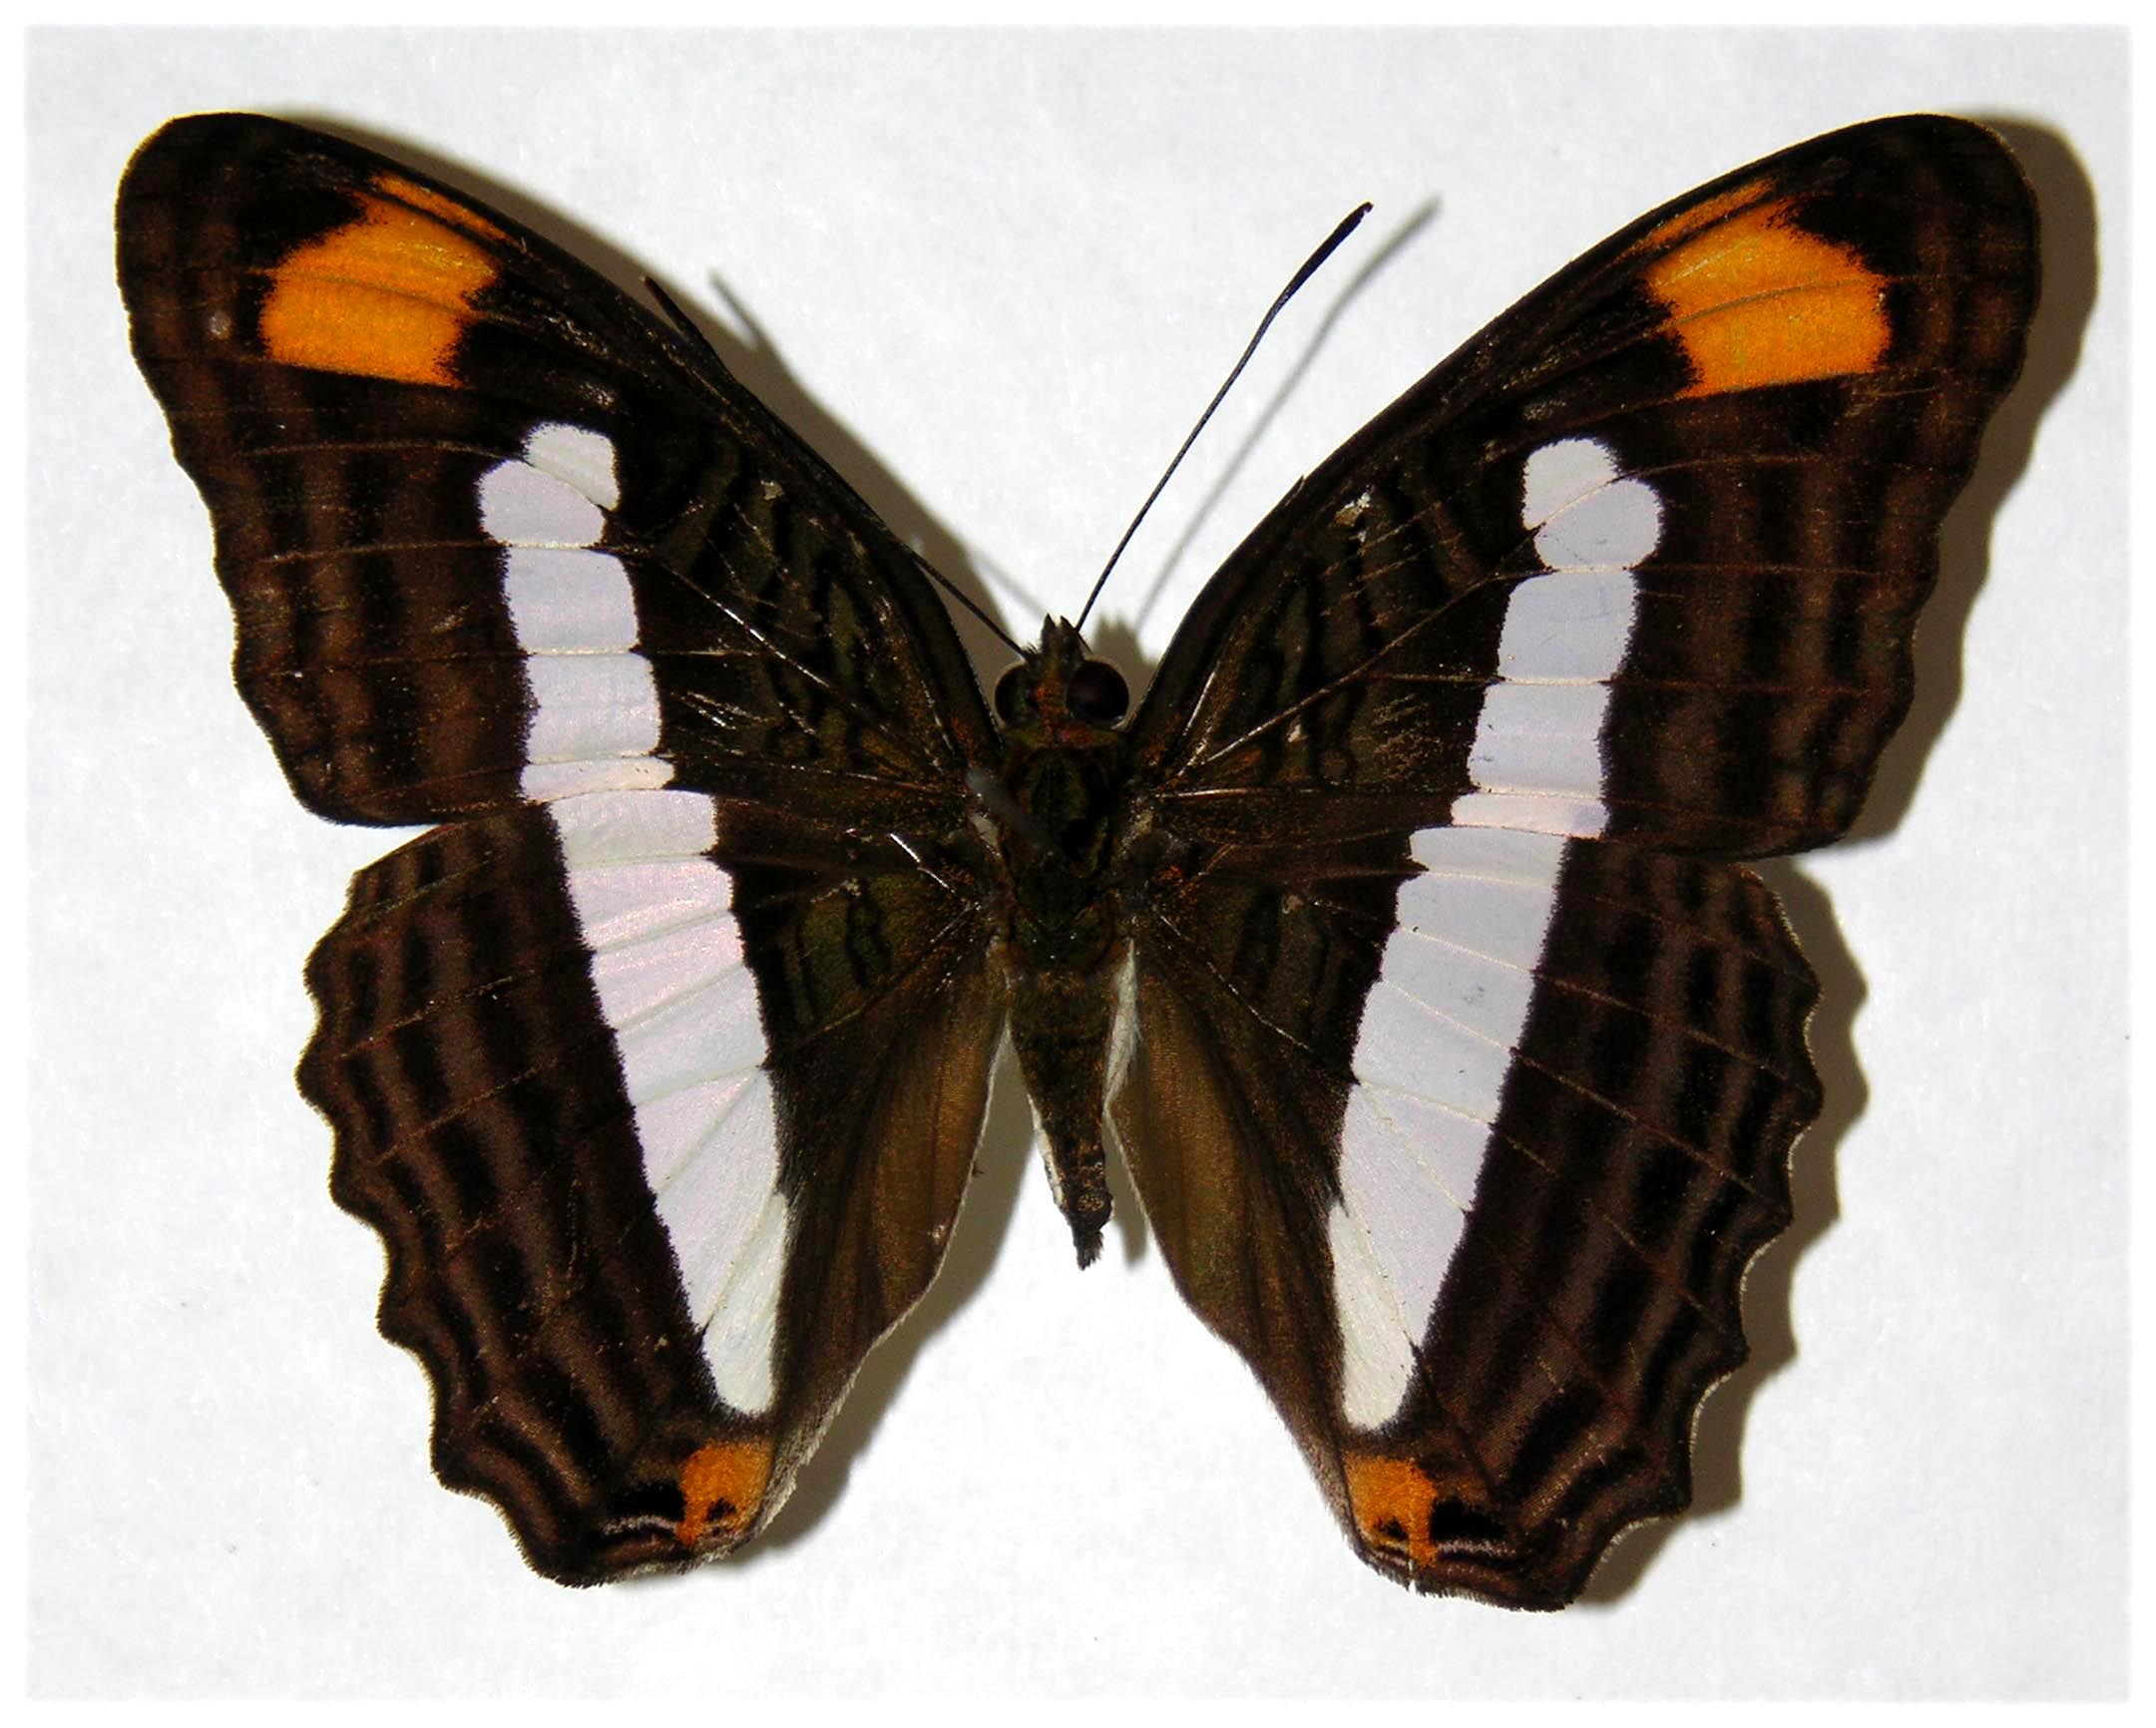
Adelpha Basiloides
|
|
|

|
|
Archaeoprepona Demophoon
|
Siderone Marthesia
|
Callicore Lyca
|
|
|
|
|
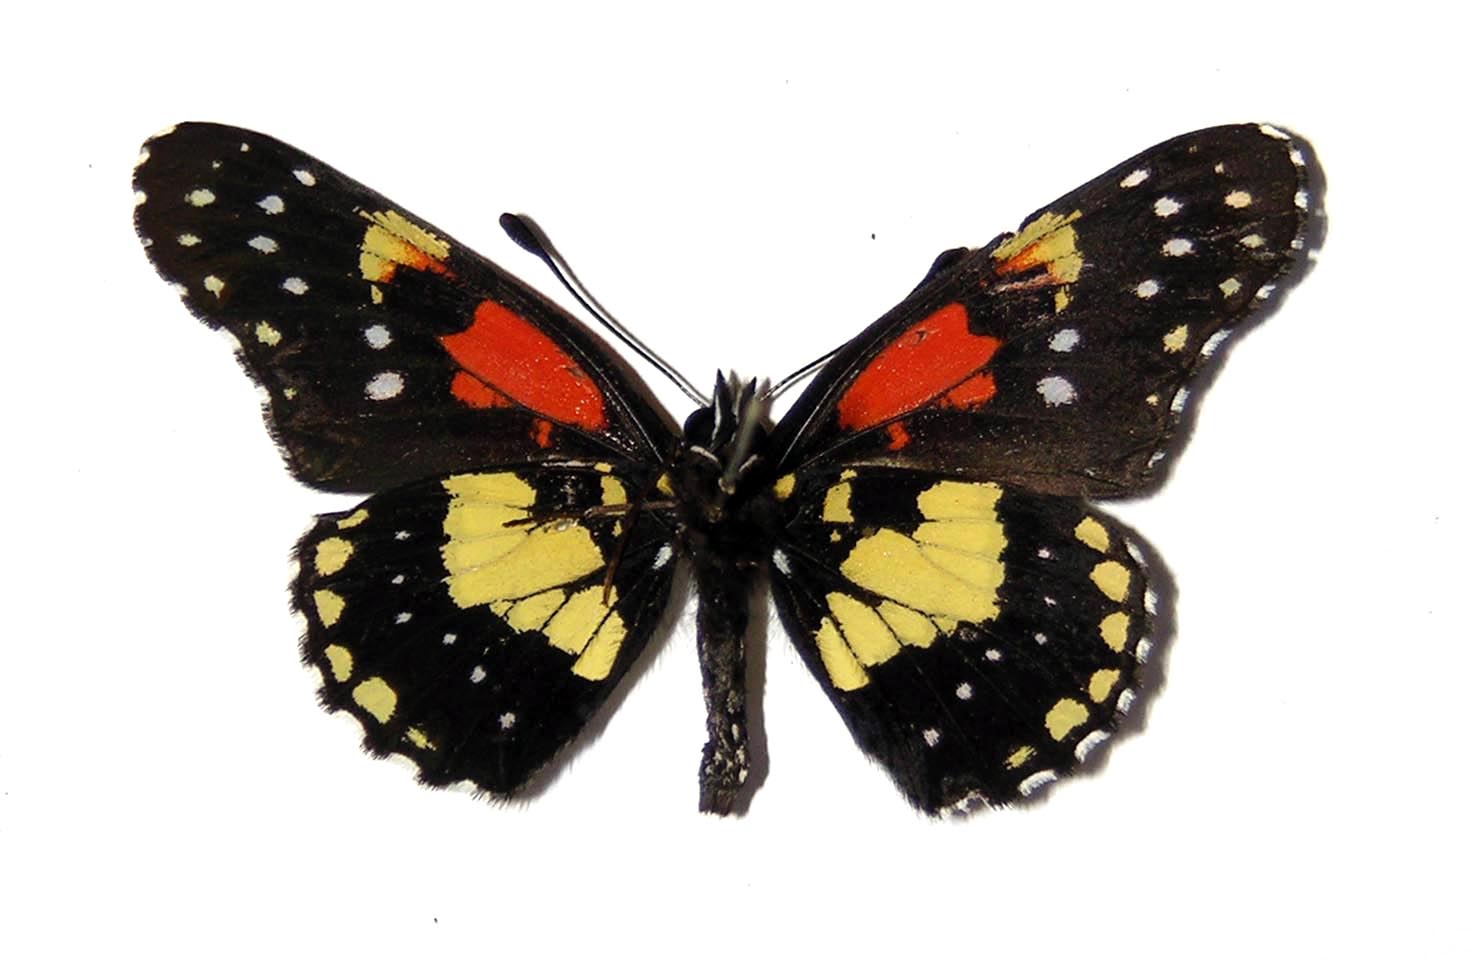
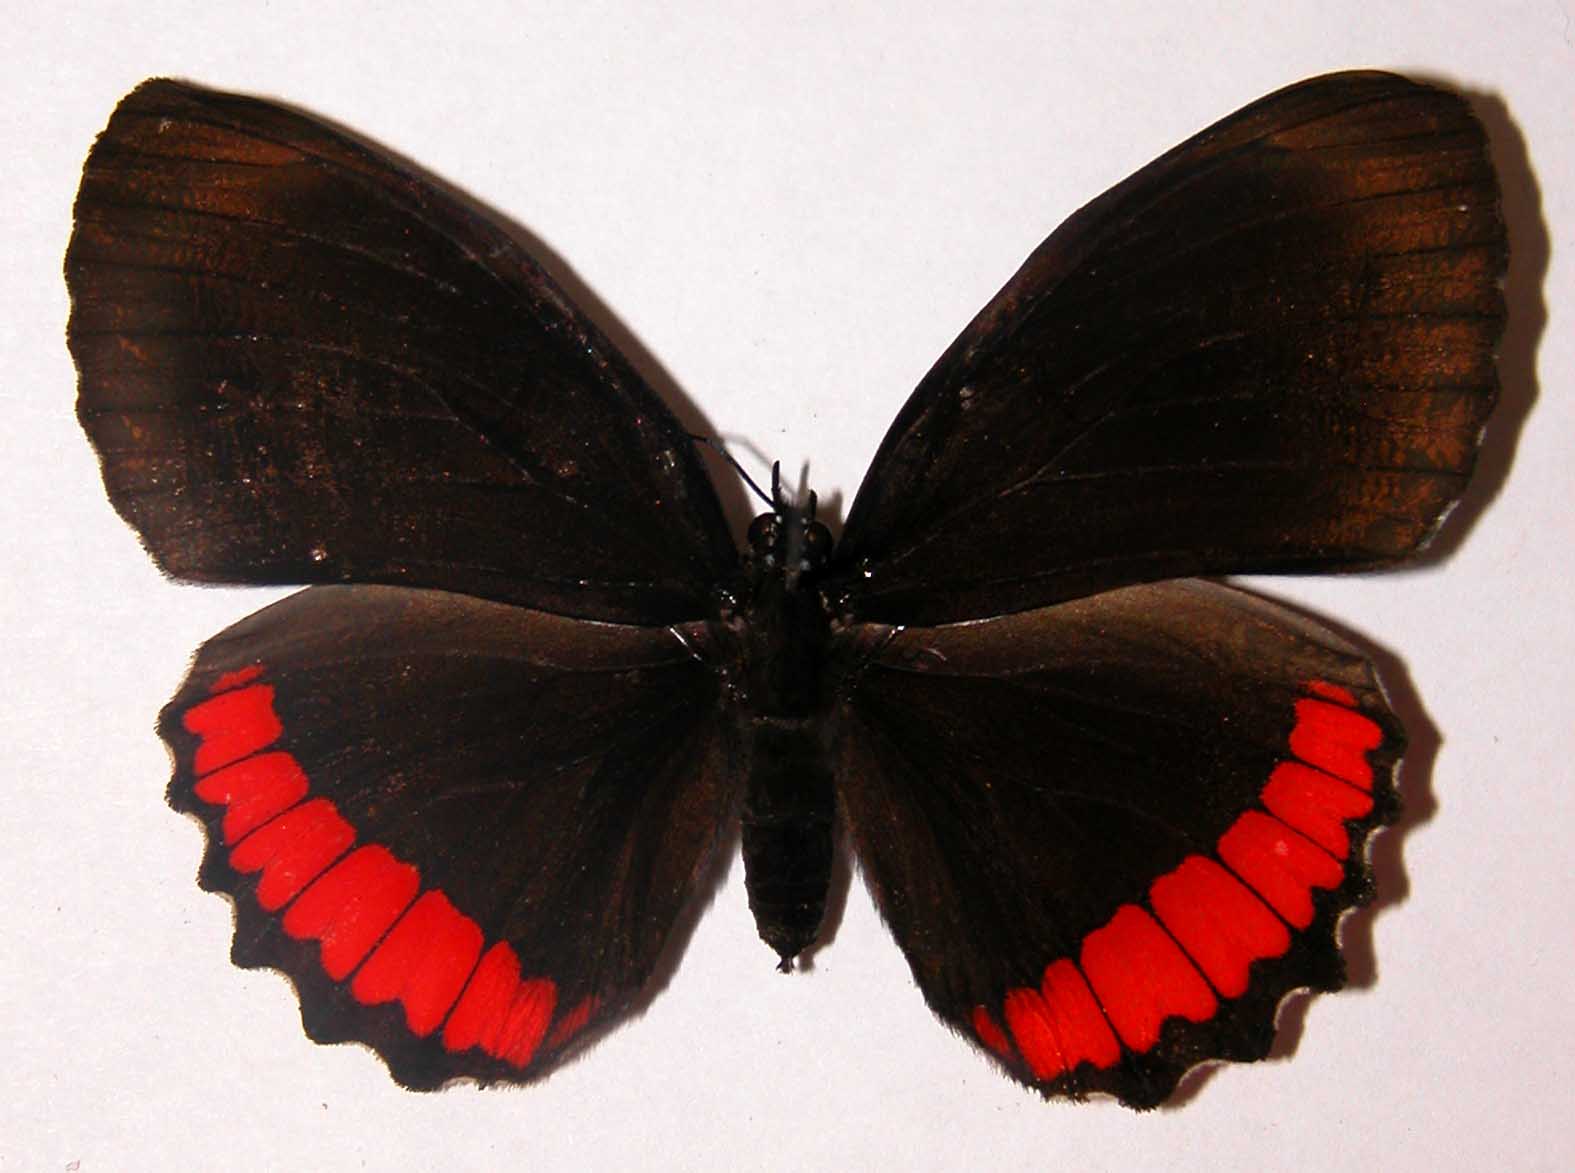
Chlosyne Gaudialis
|
Biblis Hyperia
|
Danaus Plexippus
|
|
|
|
|
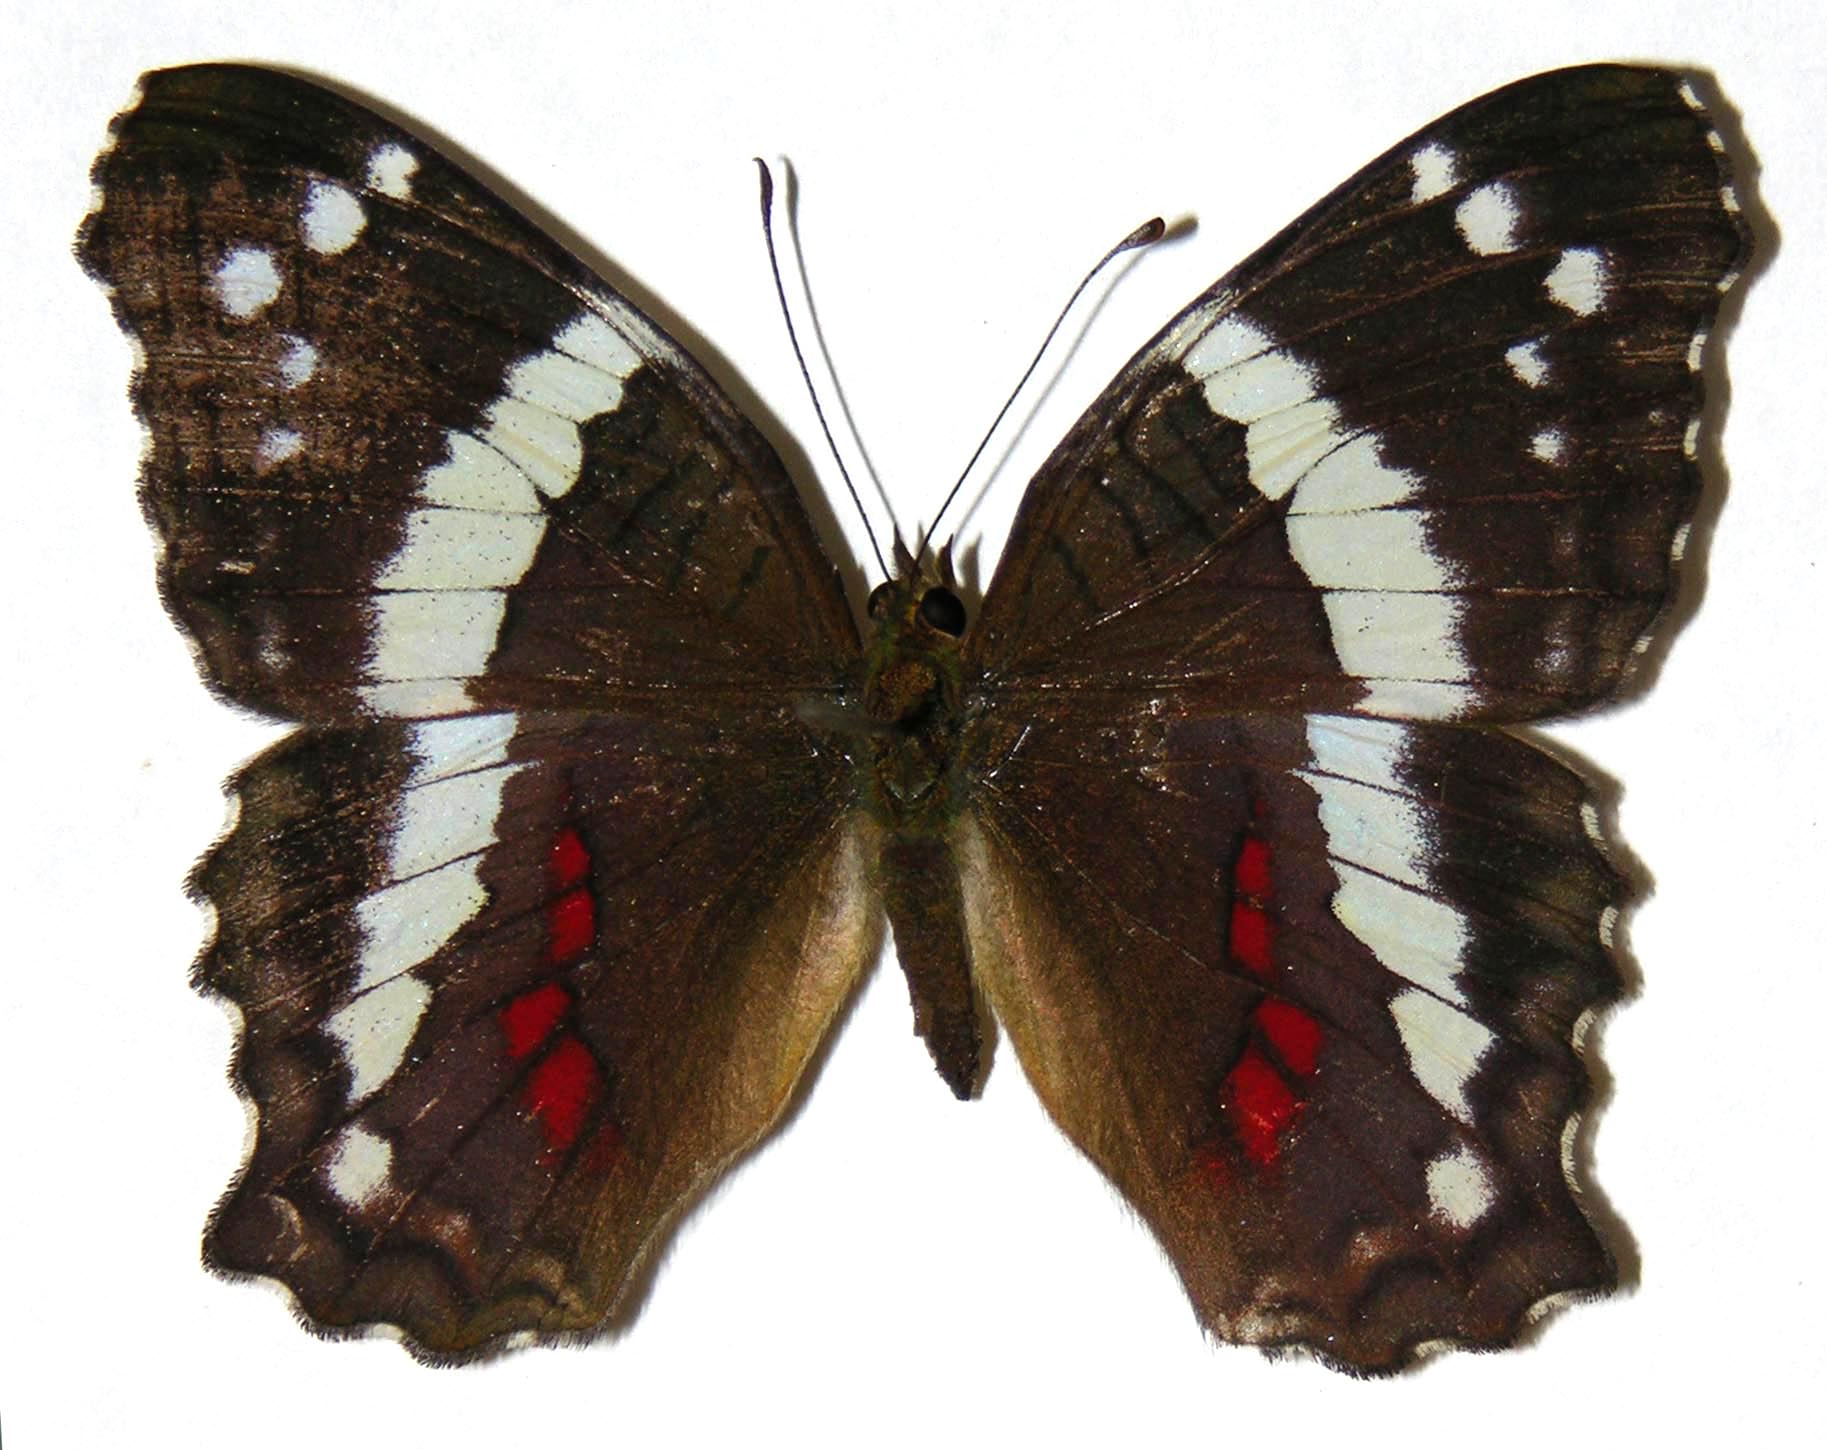
Anartia Fatima
|
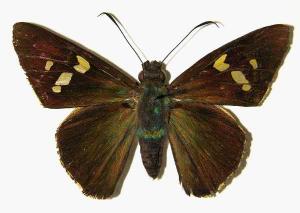
Hesperiidae Hesperiinae
Perichares-philetes
|
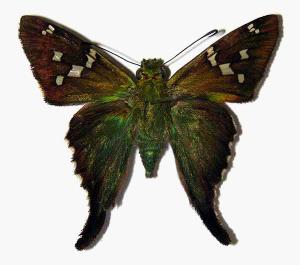
Hesperiidae Pyrginae
Urbanus-belli
|
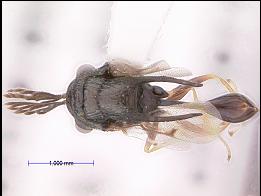
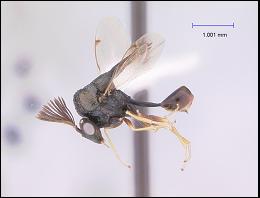
Wasps-
|
|
|
Male Kapala floridana, dorsal and lateral view.
|
|
|
|
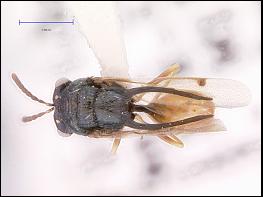
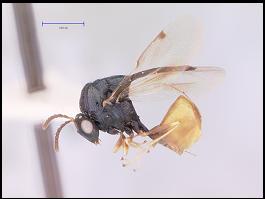
Female Kapala floridana, dorsal and lateral view.
|
|